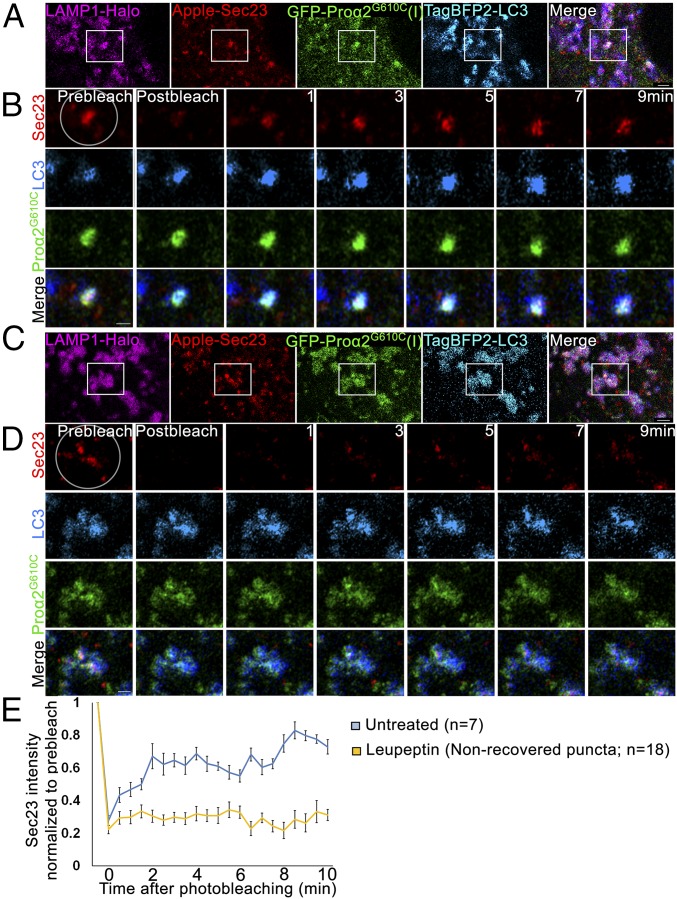
Fig. 9.
Sec23 dynamics in procollagen autophagic ERESs engulfed by lysosomal membranes. (A and C) Single-slice confocal images of GFP-proα2G610C(I), TagBFP2-LC3, Apple-Sec23, and LAMP1-Halo–positive puncta in untreated MC3T3 cells (A) and after 6-h 100 µM leupeptin treatment (C). Individual blue channels are displayed in cyan. (Scale bars: 2 µm.) (B and D) High-magnification, single-slice Airyscan microscopy images of the boxed regions before and 0, 1, 3, 5, 7, and 9 min after Apple-Sec23 photobleaching within the circled area (selected from full 30-s-per-image time-lapse sets shown in Movie S5). Individual blue channels are displayed in cyan. (Scale bars: 1 µm.) (E) Average kinetics of Apple-Sec23 fluorescence recovery in untreated cells and in cells pretreated for 6 h with 100 µM leupeptin. In the treated cells, the kinetics are shown only for the puncta that exhibited no fluorescence recovery (∼65% of all puncta); average kinetics of fluorescence recovery in the other 35% of the puncta is shown in SI Appendix, Fig. S8. Graph displays mean intensity relative to the prebleach value ± SEM.

