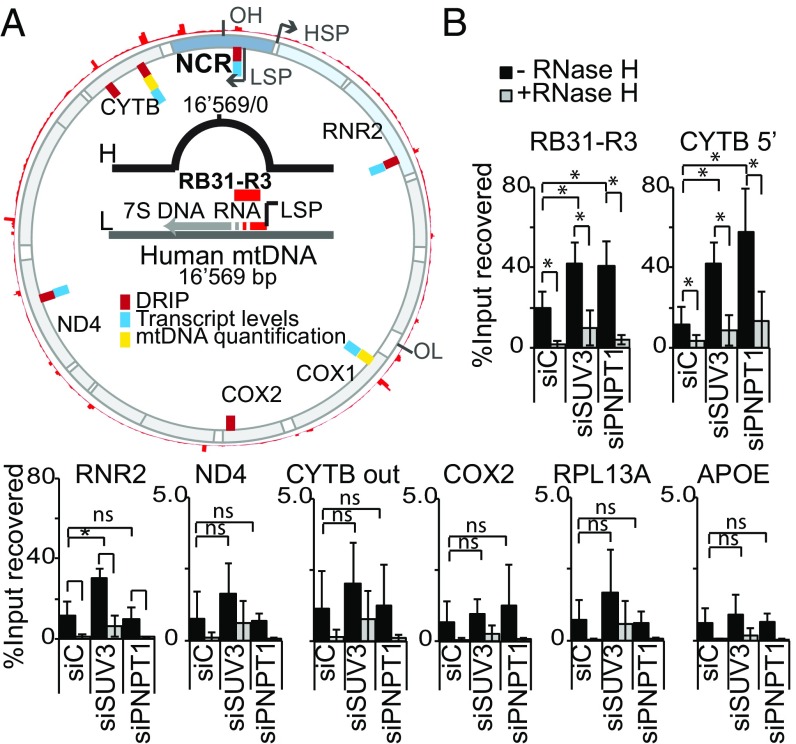
Fig. 4.
Analysis of R-loop accumulation in the mitochondrial genome by DRIP-qPCR in HeLa cells depleted of SUV3 and PNPase. (A) Diagram of the human mtDNA showing features relevant for this study. Outermost red peak profile represents the alignment of R-loop accumulating sequences along the mitochondrial genome. Inner red dashes represent the location of primers used for DRIP experiments; blue dashes, primers used for mtRNA expression levels; and yellow dashes, primers used for quantifying mtDNA relative to nuclear DNA content. Diagram in the center details the position of the primers targeting the stable R loop present at the NCR, downstream of the LSP (RB31-R3). (B) DRIP analysis showing the percentage of recovered input from S9.6 IP as mean value ± SD from at least four independent experiments for each region of interest. Nuclear genes included as controls (RPL13A and APOE). Differences were analyzed using t test (*P < 0.05).

