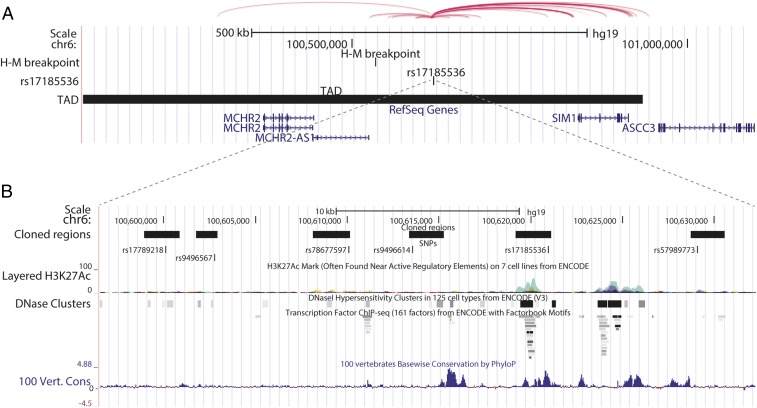
Fig. 2.
Genomic and epigenetic annotations of the SIM1 locus. (A) A University of California, Santa Cruz genome browser snapshot of the SIM1 locus showing rs17185536, the TAD in this region, the human–mouse (H–M) synteny breakpoint, and the virtual 4C (circularized chromosome conformation capture) interactions from human GM12878 cells adapted from the 3D Genome Browser (54). (B) A zoomed-in view of the regions that were cloned for enhancer assays showing the cloned regions, the SNPs, the ENCODE human skeletal muscle cells and myoblasts ChIP-seq peaks (green), ENCODE DNaseI hypersensitivity sites, ENCODE transcription factor ChIP-seq sites, and evolutionary conservation peaks (blue peaks) (B).

