Fig. 3.
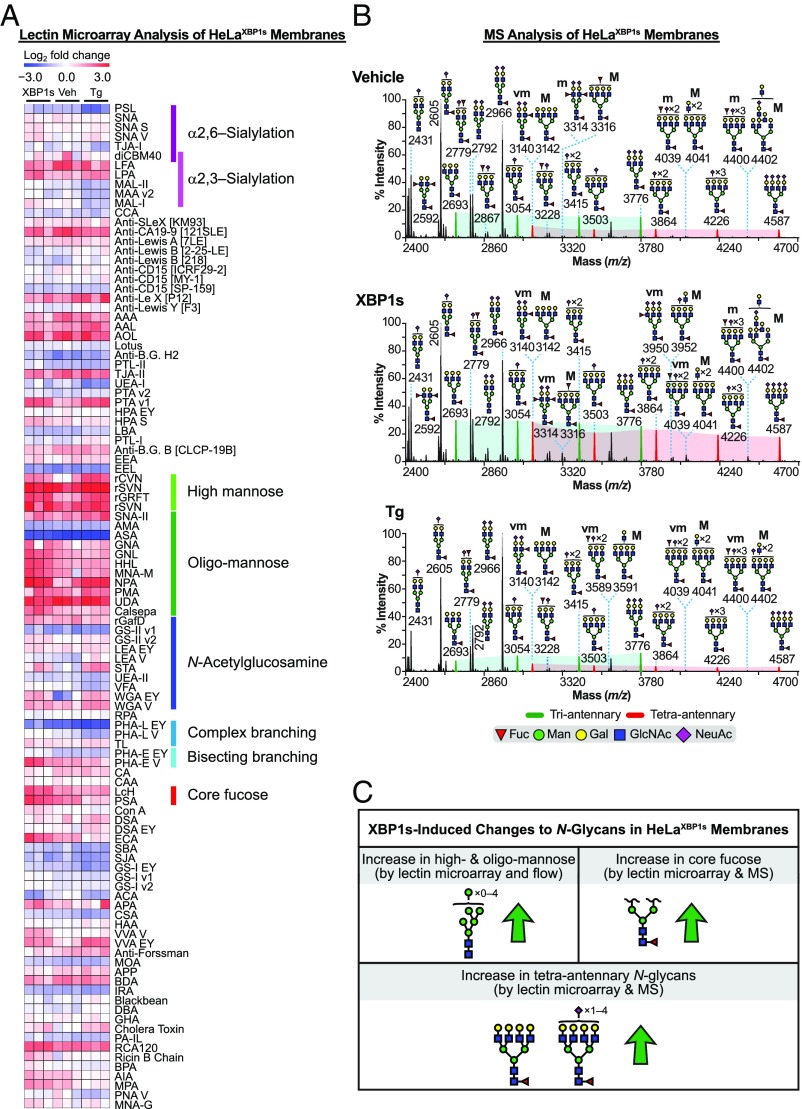
Analysis of the HeLaXBP1s membrane glycoproteome. (A) Heatmap of lectin microarray data generated from HeLaXBP1s membrane glycoproteomes. Full lectin names, print concentration, and sources are listed in Dataset S2B. Color intensity represents normalized log2 ratio data relative to a pooled sample reference. Each column represents one biological replicate of the indicated sample. Select lectin groups with shared binding specificities are annotated (Right). See also SI Appendix, Fig. S5C and Dataset S3B. (B) Partial MALDI-TOF mass spectra from the HeLaXBP1s membrane proteome. Green and red peaks correspond to tri- and tetraantennary N-glycans with various levels of sialylation. Green- and red-shaded areas highlight the increased abundance of tetraantennary N-glycans. The designation “vm” indicates very minor species; see Fig. 2B legend for description of other annotations. High-mass spectra and selected MS/MS fragmentations are presented in SI Appendix, Fig. S5 A and B, with GC-MS data in SI Appendix, Table S1. (C) Summary of XBP1s-induced changes to the HeLaXBP1s membrane N-glycome (see also SI Appendix, Tables S2 and S3).

