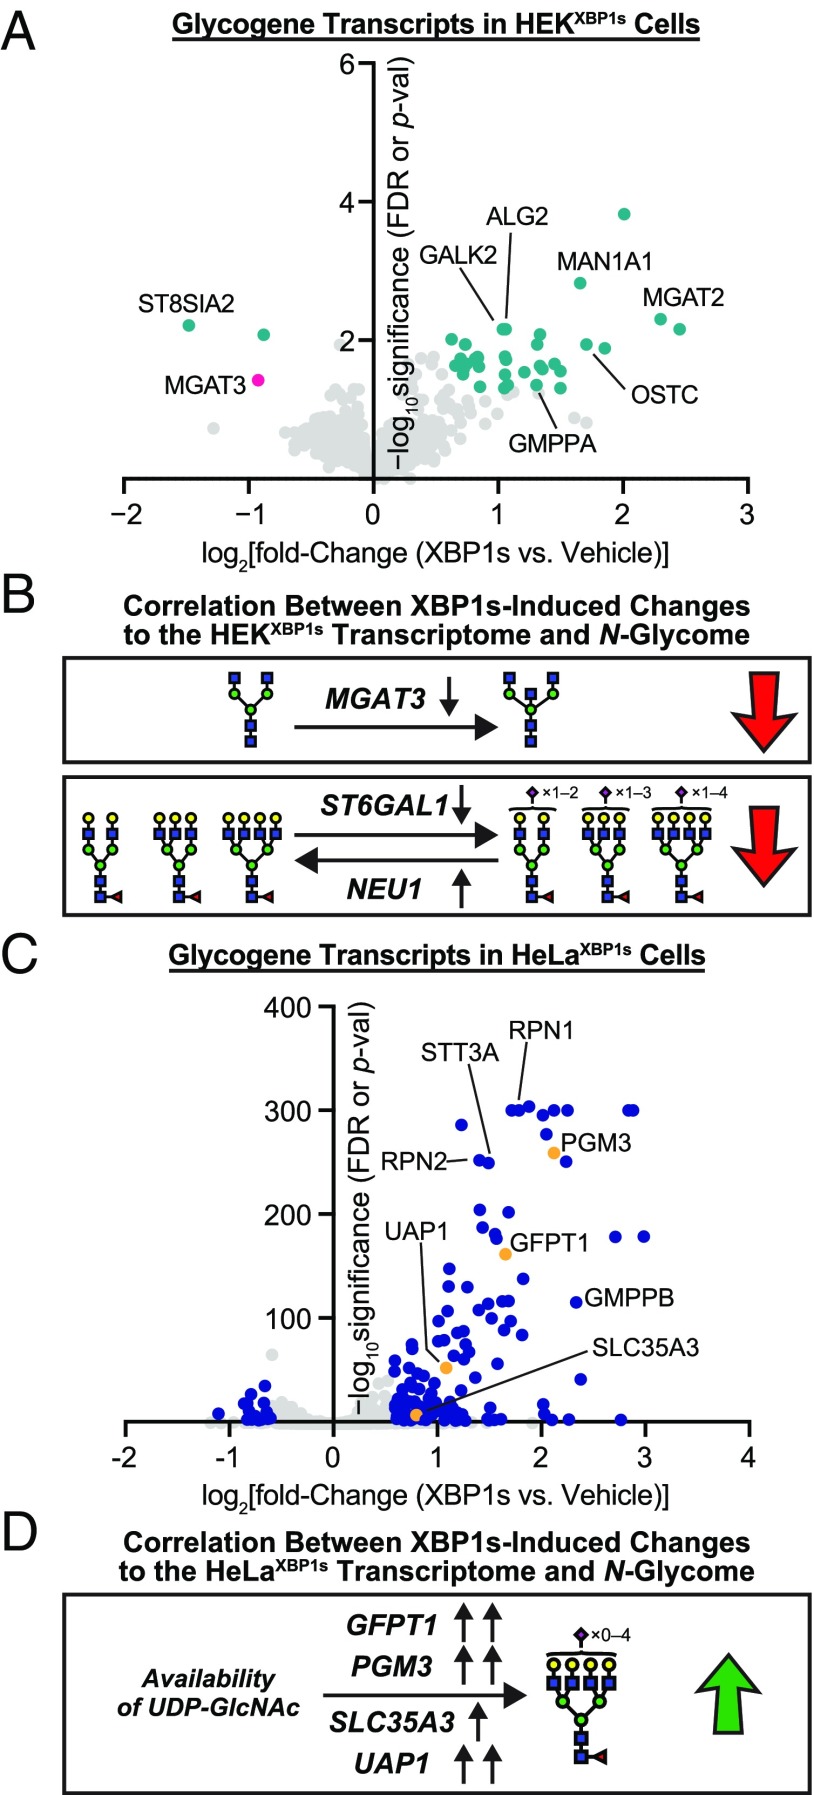
Fig. 5.
Glycogene analysis in HEKXBP1s and HeLaXBP1s cells. (A) Volcano plot showing XBP1s activation-induced changes in glycosylation-related transcripts in HEKXBP1s cells. Glycogenes analyzed are listed in Dataset S5B. Data shown were obtained either from the Qiagen Human Glycosylation qPCR Array or, if a transcript of interest was not included in the qPCR array, extracted from previously published HEKXBP1s microarray data (4). Transcripts shown in teal meet significance and fold-change thresholds of FDR or P value ≤0.05 and fold change ≥1.5 upon XBP1s activation. Gene symbols are shown for outliers and transcripts of particular interest. (B) Decreased expression of MGAT3 (shown in pink in A), a GlcNAc transferase (36), could account for the loss in bisecting GlcNAc observed on HEKXBP1s secreted and membrane glycoproteins upon XBP1s activation. Decreased expression of ST6GAL1 and increased expression of NEU1 could account for the reduced sialylation observed for HEKXBP1s secreted and membrane glycoproteins upon XBP1s activation. (C) Volcano plot showing XBP1s activation-induced changes in glycosylation-related transcripts in HeLaXBP1s cells. Glycogenes analyzed are listed in Dataset S5B. Data shown were obtained either from the Qiagen Human Glycosylation qPCR Array or, if a transcript of interest was not included in the qPCR array, extracted from the RNA-seq data. Transcripts shown in blue meet significance and fold-change thresholds of FDR or P value ≤0.05 and fold change ≥1.5 upon XBP1s activation. Gene symbols are shown for outliers and transcripts of particular interest. (D) Increased expression of GFPT1, PGM3, SLC35A3, or UAP1, which are enzymes involved in regulating UDP-GlcNAc availability (shown in orange in C), could contribute to increased tetraantennary N-glycans observed on HeLaXBP1s membranes upon XBP1s activation.

