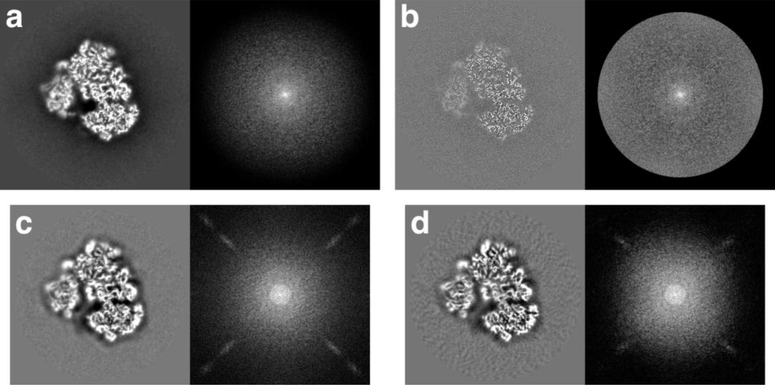
Figure 3:
Examples of submitted maps for the ribosome case to highlight some issues that can be identified by visual inspection. In each panel the left side shows a central slice and the right side shows the logarithm of the power spectrum. (a-b) The best ribosome map (123) unfiltered (a) and filtered (b). (c-d) Two of the worst ribosome maps (c – 111, d – 119). For both these submissions the unfiltered and filtered maps are identical

