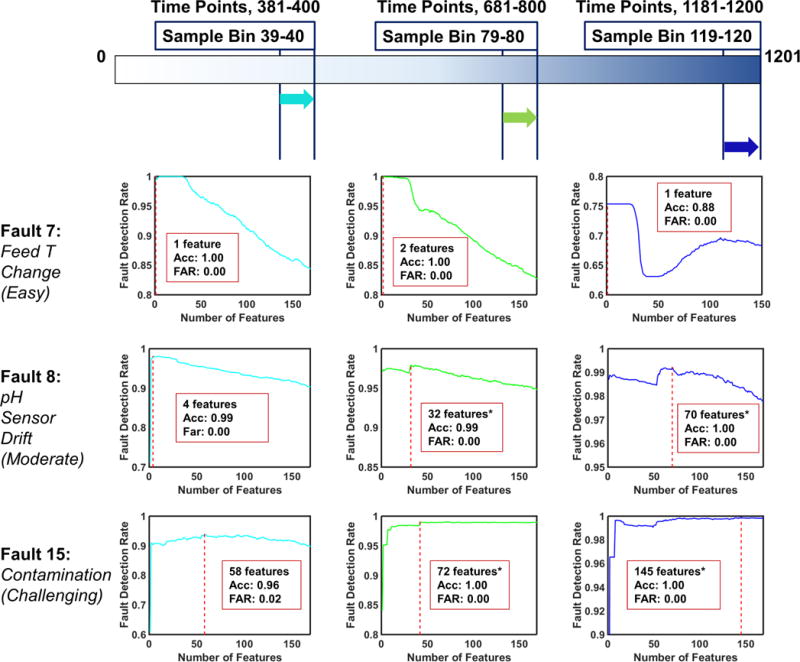
Figure 9.

Two-step Rolling Time Horizon Analysis: Detection Rates of Fault 7,8, and 15. The optimal number of features, detection accuracy and false alarm rate are provided at the highest detection rate. The results with asterisks indicate the existence of an alternative model producing almost equivalent performance with less features. Alternative models are provided in Table 4.
