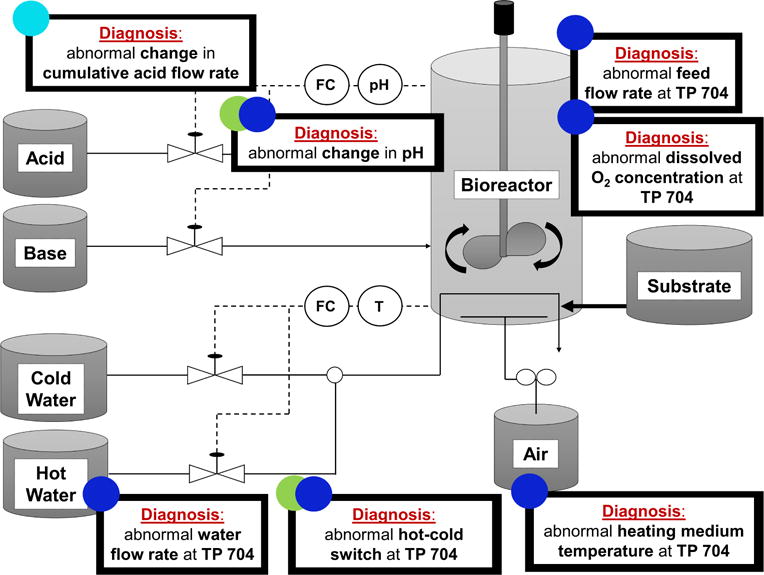
Figure 12.

Diagnosis of Fault 8 (pH sensor drift) with One-step Rolling Time Horizon based Approach at selected Sample Bins. TP represents Time Point. The color codes indicate the sample bin index which is compatible with the Figure 8. (Cyan: Sample Bin 40, Green: Sample Bin 80, Blue: Sample Bin 120).
