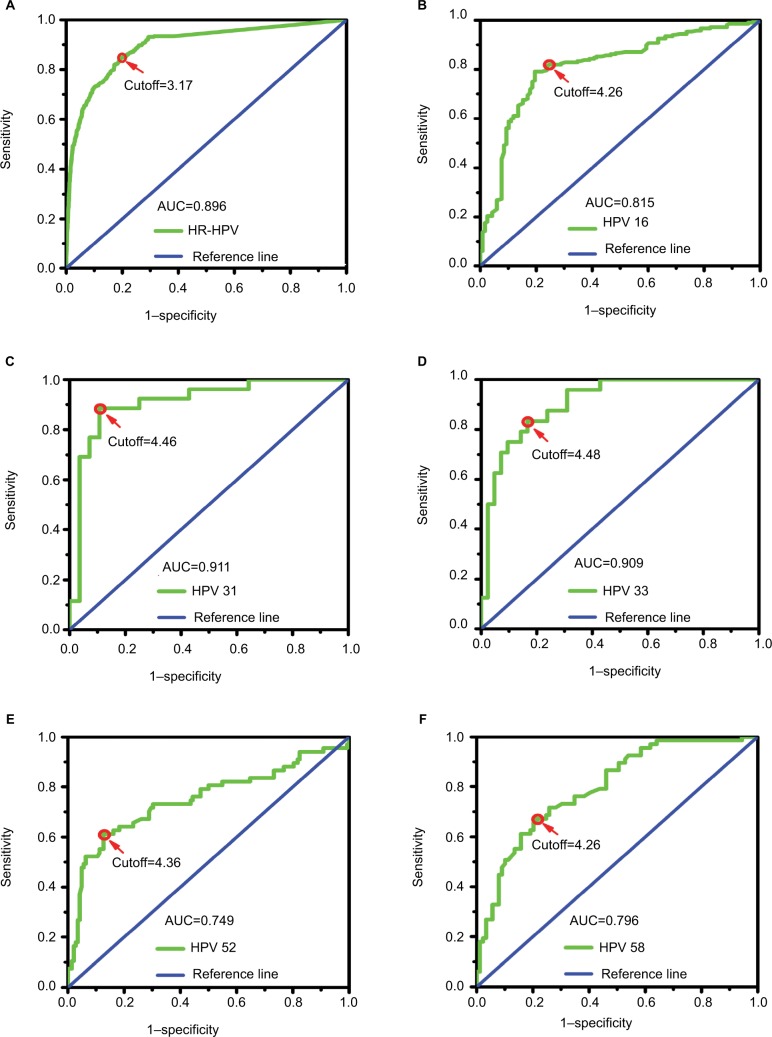
Figure 2.
ROC curve analysis of type-specific HPV viral loads for identifying ≥HSIL.
Notes: Cutoff, the optimal viral load level used to predict ≥HSIL calculated according to the ROC curve. (A–F) ROC curve analysis of 14 HR-HPVs, HPV-16, -31, -33, -52, and -58 viral loads for identifying ≥HSIL, respectively.
Abbreviations: AUC, the area under the ROC curve; HPV, human papillomavirus; HR-HPV, high-risk HPV; ≥HSIL, high-grade squamous intraepithelial lesion or worse; ROC, receiver operator characteristic.

