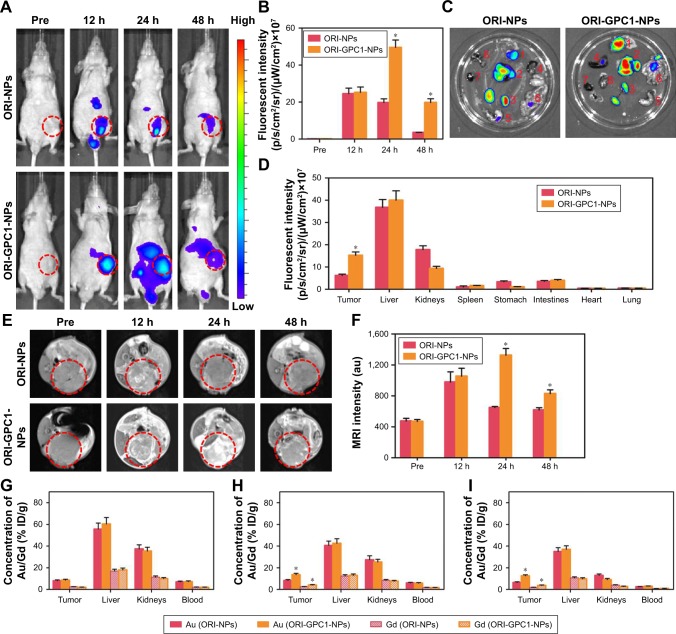
Figure 6.
In vivo NIRF/MRI and ICP-MS.
Notes: (A) In vivo NIRF images and (B) their fluorescent intensity of tumor-bearing nude mice at specified times after injection of ORI-NPs or ORI-GPC1-NPs. (C) Ex vivo NIRF images (Organs: 1. Tumor, 2. Liver, 3. Kidneys, 4. Spleen, 5. Stomach, 6. Intestine, 7. Heart, 8. Lung) and (D) fluorescent intensity of tumor and major organs at 48 hours after injection of ORI-NPs and ORI-GPC1-NPs. Organs: tumor, liver, kidneys, spleen, stomach, intestines, heart, and lung. (E) In vivo MR images and (F) MRI intensity of tumor- bearing nude mice at specified times after injection of ORI-NPs or ORI-GPC1-NPs. Au and Gd concentrations in tumors and major organs were measured by ICP-MS at (G) 12 hours, (H) 24 hours, and (I) 48 hours. *P<0.05, for ORI-NPs vs ORI-GPC1-NPs.
Abbreviations: Au, gold; Gd, gadolinium; ICP-MS, inductively coupled plasma mass spectrometry; MR, magnetic resonance; MRI, magnetic resonance imaging; NIRF, near- infrared fluorescence; ORI-NPs, Gd-ORI@HAuNCs-Cy7 nanoparticles; ORI-GPC1-NPs, GPC1-Gd-ORI@HAuNCs-Cy7 nanoparticles.

