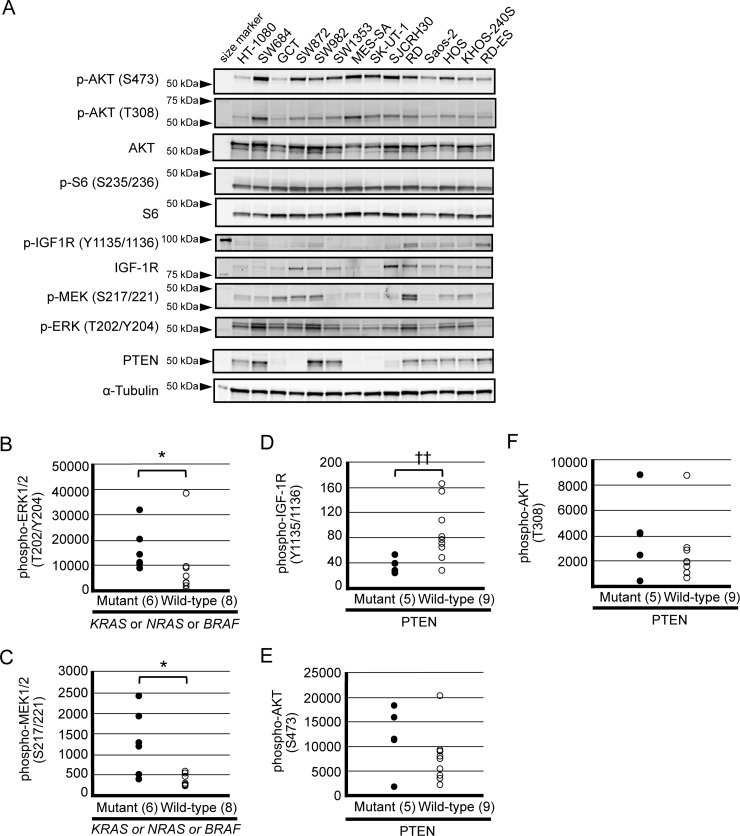
Figure 1. Baseline expression of signaling molecules within the PI3K pathway (AKT, S6, IGF-1R and PTEN) and MEK-ERK pathway in a panel of sarcoma cell lines.
(A) Western blot analysis of phosphorylated AKT (S473), phosphorylated AKT (T308), total AKT, phosphorylated S6 (S235/236), total S6, phosphorylated IGF-1R (Y1135/1136), total IGF-1R, phosphorylated MEK 1/2 (S217/221), phosphorylated ERK 1/2 (T202/Y204), PTEN and α-tubulin was performed using cellular extracts obtained from each cell line as described in the Materials and Methods section. (B–F) Detected signals were quantified by an Odyssey CLx Imaging System. Association between aberrant gene status and protein expression levels was determined by a Mann–Whitney U test (*p < 0.05)/ Welch t test (††p < 0.01).

