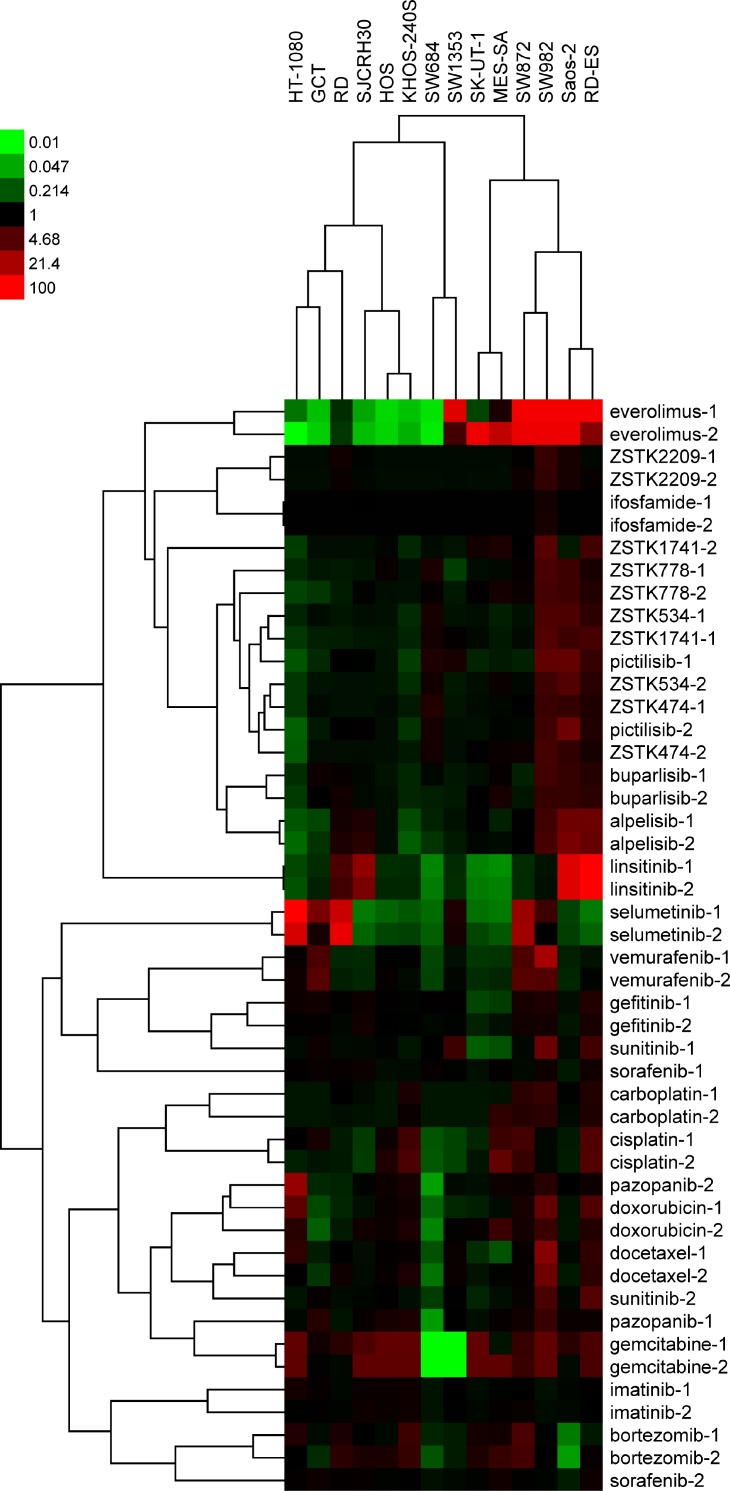
Figure 2. Hierarchical clustering of antiproliferative fingerprints of 24 anticancer compounds across 14 sarcoma cell lines and their relative antitumor activities visualized via a heatmap.
The GI50 concentration in each cell line was determined and log-transformed. The compounds were clustered on the basis of their correlations with other compounds (average-linkage clustered with Pearson correlation metric). Cluster analysis and visualization by heatmap was performed by using Cluster3.0/TreeView software (Stanford University). Black represents the average |log GI50| for each compound across the 14 cell lines assessed. Red and green represent sensitivity and resistance by 100-fold, respectively.

