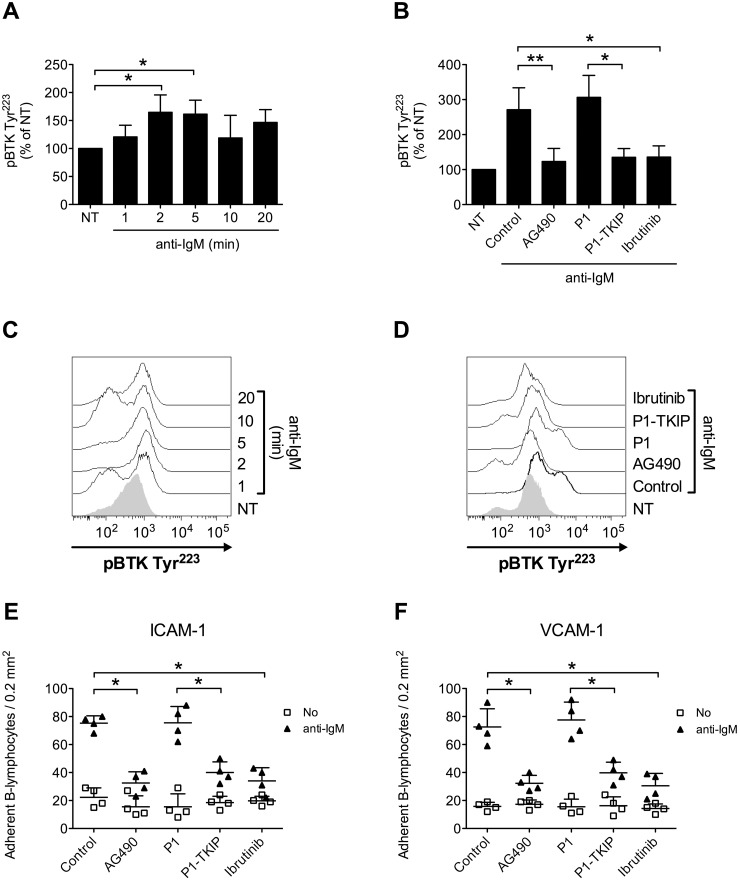
Figure 8. JAK2-dependent BTK activation mediates BCR-triggered adhesion of CLL B-lymphocytes.
(A) Cells were treated with buffer (NT) or anti-IgM 10 μg/ml for indicated times. Mean ± SD. *, P < 0.05, versus NT. Data are average of n = 4 independent experiments. (B) Cells were treated with buffer (NT and Control), AG490 100 μM, P1-TKIP 40 μM for 1 h, or Ibrutinib 10 μM, and stimulated with anti-IgM 10 μg/ml for 5 min. Mean ± SD. *, P < 0.05; *, P < 0.01, versus Control or P1. Data are average of n = 4 independent experiments. (C) Histograms of fluorescence of a representative experiment of data shown in (A). (D) Histograms of fluorescence of a representative experiment of data shown in (B). Static adhesion to ICAM-1 (E) or VCAM-1 (F): cells were treated and stimulated as in (B). Mean ± SD. *, P < 0.01, versus Control or P1. Data are average of n = 5 independent experiments.

