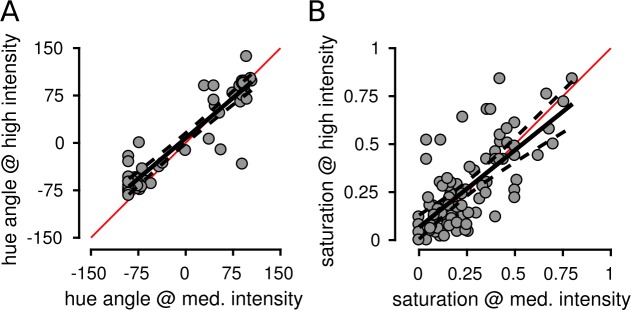
Figure 5.
Hue and saturation judgments were correlated across stimulus intensities. Medium and high stimulus intensities were compared. Each point represents the mean response from an individual L or M cone across all seen trials at the indicated stimulus intensity. Data are shown from S20076. Hue angles (A) and saturation values (B) were highly correlated across stimulus intensity levels. Solid black line indicates best fit regression and dotted lines are 95% confidence intervals. Red line = unity.

