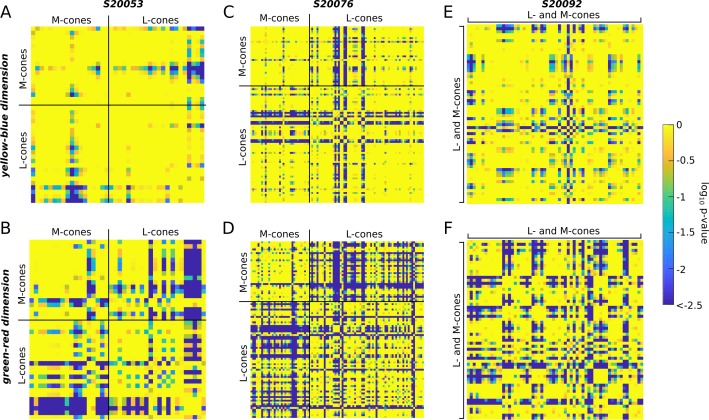
Figure 7.
Cones with the same photopigment yield different sensations. An analysis of variance revealed a main effect for cone targeted on hue/saturation scaling. The results of post hoc tests (Tukey–Kramer) are shown. The mean response (UAD) measured for each cone was compared to all other cones. Comparisons were organized according to cone class. Heat maps represent the statistical significance of each comparison. Bluer colors indicate that the mean responses were statistically different (deep blue denotes p ≤ 10–2.5). Yellow-blue (A, C, and E) and green-red (B, D, and F) dimensions of UAD space were assessed separately. (A–B) S20053, (C–D) S20076, (E–F) S20092. The diagonal yellow line of each matrix corresponds to the location where each cone was compared with itself. Each matrix is symmetric along the diagonal axis—that is, the top and bottom triangles are mirror images.

