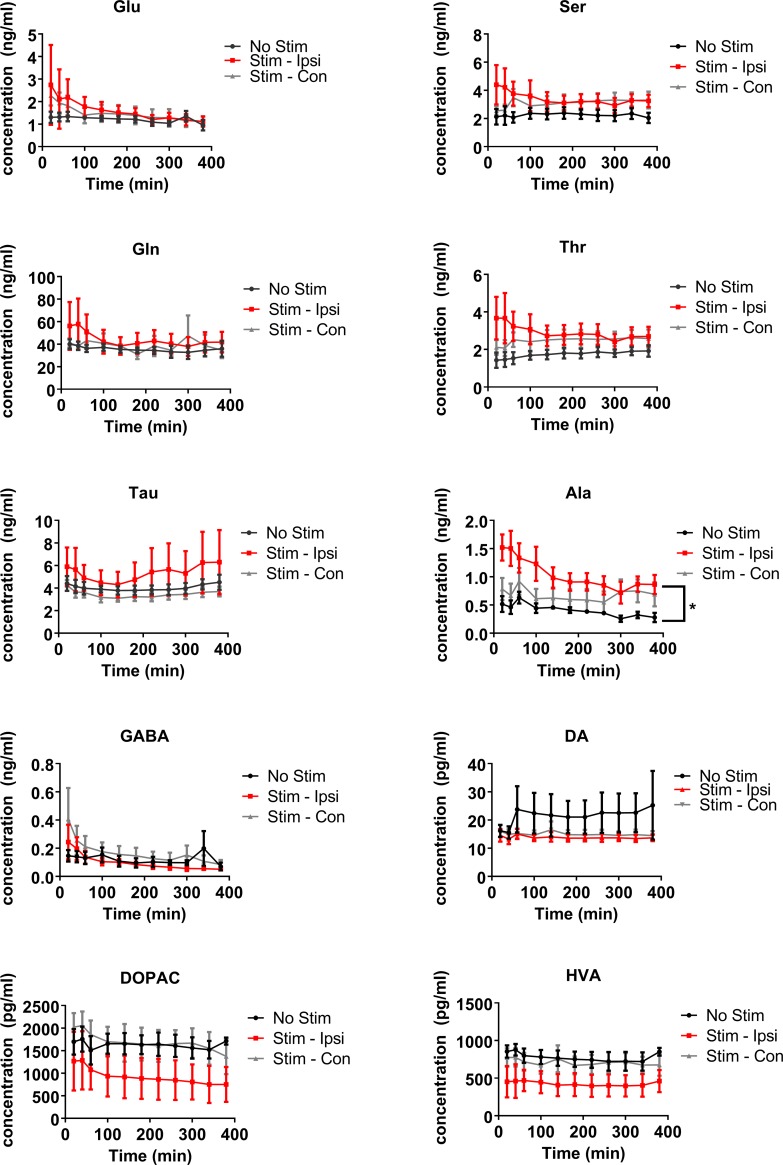
Fig 4. Changes in the levels of neurochemicals of non-stimulation samples in the striatum of rats that were allocated to either the electrical vestibular stimulation or no stimulation treatment groups.
Glu–glutamate; Ser–serine; Gln–glutamine; Thr–threonine; Tau–taurine; Ala–alanine; DA–dopamine; DOPAC– 3,4-dihydroxyphenylacetic acid; HVA–homovanillic acid. Stim—Ipsi–samples collected on the side ipsilateral to stimulation; Stim—Con–samples collected on the side contralateral to stimulation. Data points are represented as mean ± SEM. Only significant main treatment effects, i.e. due to stimulation alone, are shown for clarity (i.e. no interactions). * = P ≤ 0.05.

