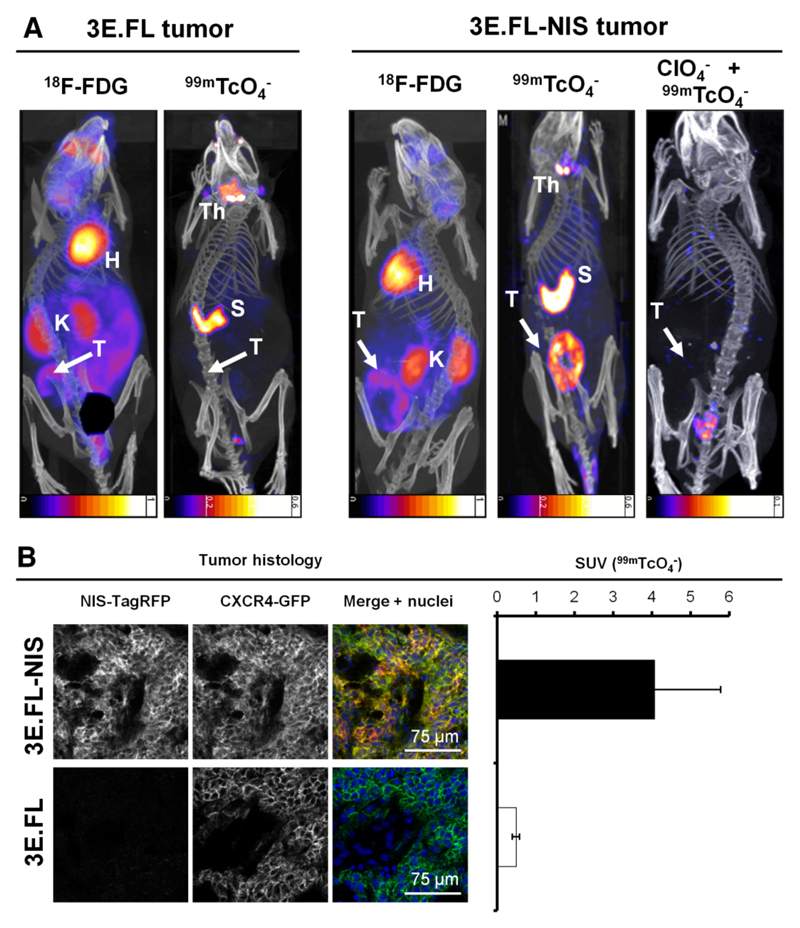
Figure 2. In vivo NIS- and FDG-imaging of xenograft tumors established from NIS-expressing breast cancer cell lines.
(A) Tumors established from 3E.FL cells expressing FL CXCR4-GFP but not NIS-TagRFP (left) or 3E.FL-NIS cells expressing FL CXCR4-GFP and NIS-TagRFP. Four weeks post tumor cell injection into the mammary fat pad, tumors were first imaged by FDG-PET and one day later by SPECT/CT using 99mTcO4-. As expected, no signals were collected by SPECT/CT in the case of 3E.FL tumors. As for 3E.FL-NIS tumors, FDG-PET/CT signals were comparable to 3E.FL tumors but SPECT/CT signals were very pronounced. NIS specificity was tested in the same animals 72 hours later by treatment with perchlorate before repeating the 99mTcO4--afforded SPECT/CT scans. All 99mTcO4- signals (as compared to the earlier image, middle) disappeared proving successful NIS inhibition and thus NIS specificity. Images are maximum intensity projections overlaid in CT slices. 'H', 'K', Th', 'S', and 'T' are abbreviations for heart, kidney, thyroid and salivary glands, stomach, and the primary tumor. (B) Typical confocal micrographs of sections cut from primary tumors after γ-counting confirming expression of FL CXCR4-GFP in both tumors but expression of NIS-TagRFP only in the 3E.FL-NIS tumor (top row). Pooled 99mTcO4- SUVs of tumors from both cell lines obtained via γ-counting after tissue harvesting. N=3 animals with error bars representing SD.

