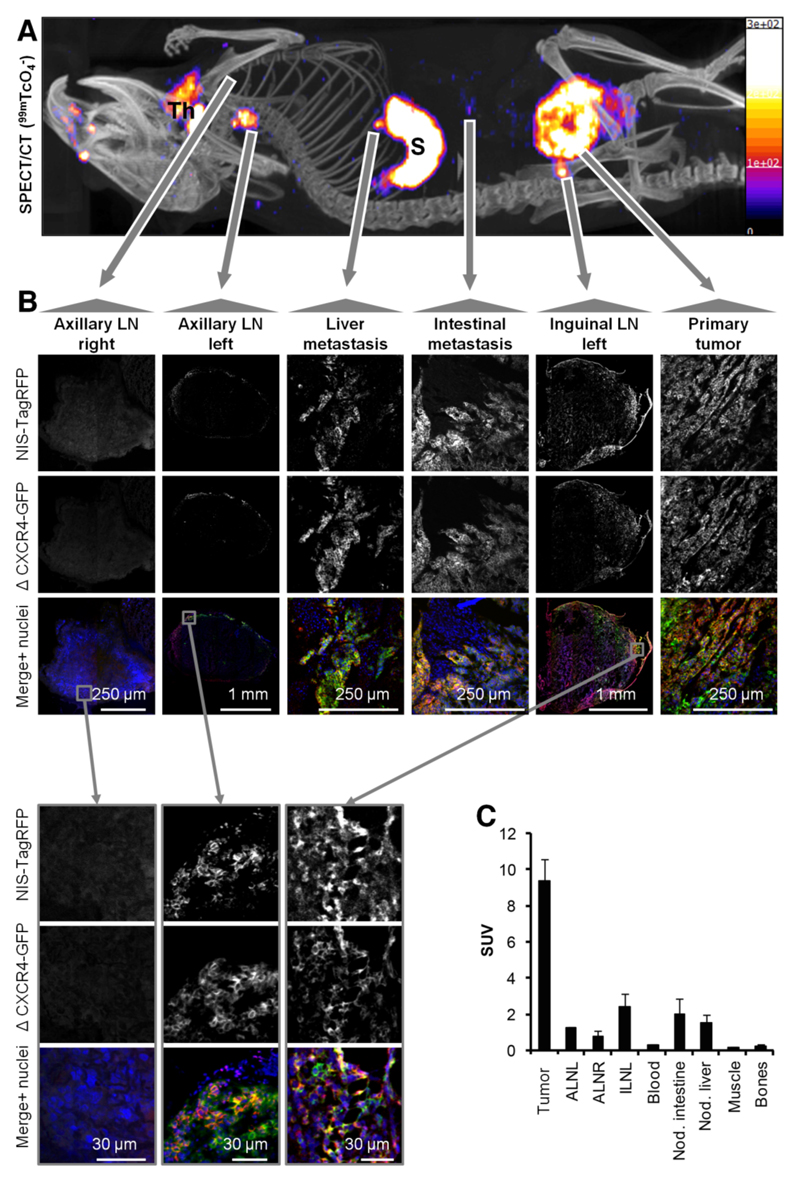
Figure 3. The NIS-based metastasis model allows reliable and sensitive detection of metastasis.
(A) Representative maximum intensity projection image (overlaid in CT slices) of a 99mTcO4- SPECT/CT scan of an animal growing a primary tumor established from 3E.Δ-NIS cells (19 days post orthotopic implantation). 'Th' indicates thyroid and salivary glands and 'S' indicates the stomach, both organs being identified due to endogenous NIS expression. Arrows originate at sites of interest and include the following objects: right axillary LN (negative for metastasis in (A)), left axillary LN (positive), liver metastasis (positive), metastatic nodule in the peritoneal cavity (positive), left inguinal LN (positive, draining LN) and primary tumor. (B) Positivity/negativity for metastasis was determined from the SPECT/CT scans and tissues were subsequently harvested, γ-counted and sectioned; confocal microscopy confirmed the classifications in all cases. LN images were obtained at low magnification to show positivity/negativity for metastasis and their respective sizes and at high magnification to show plasma membrane localization of both fusion proteins (second-level grey arrows, bottom). (C) 99mTcO4- biodistribution expressed as SUV as determined by γ-counting post tissue harvesting. Pooled data (N=4 animals) with error bars representing SEM.

