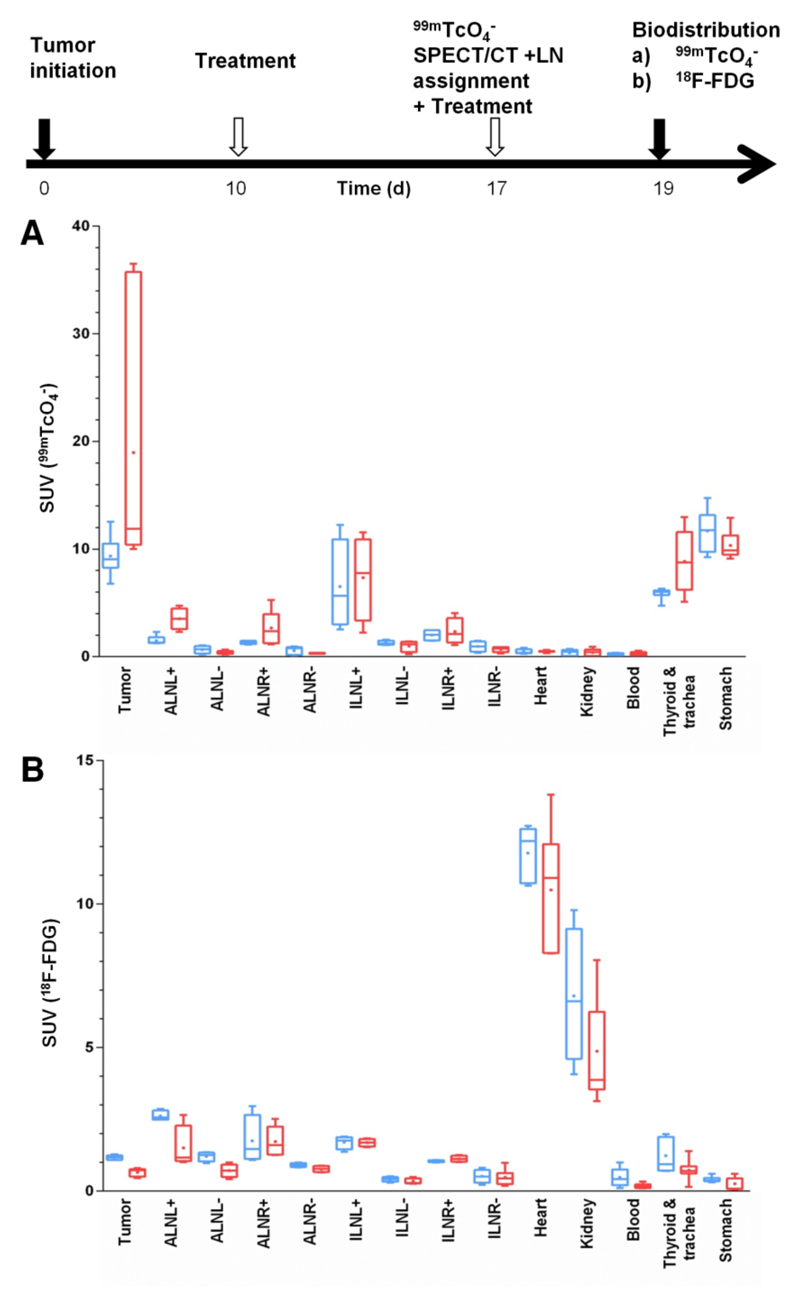
Figure 6. Etoposide treatment results in heterogeneous response in organs affected by metastatic deposits.
Experimental treatment and imaging schedule. On day 17 a 99mTcO4- SPECT/CT scan was performed to classify LNs as either positive or negative for metastasis. Two days later, quantitative organ-harvesting and γ-counting measurements were performed with (A) 99mTcO4- or (B) FDG and SUVs were calculated. Box-and-whisker plots with the line indicating the median and the dot indicating the mean; bars indicate the maximum range. Organs from treated (red) and untreated animals (blue) are shown (N=8 animals/group).

