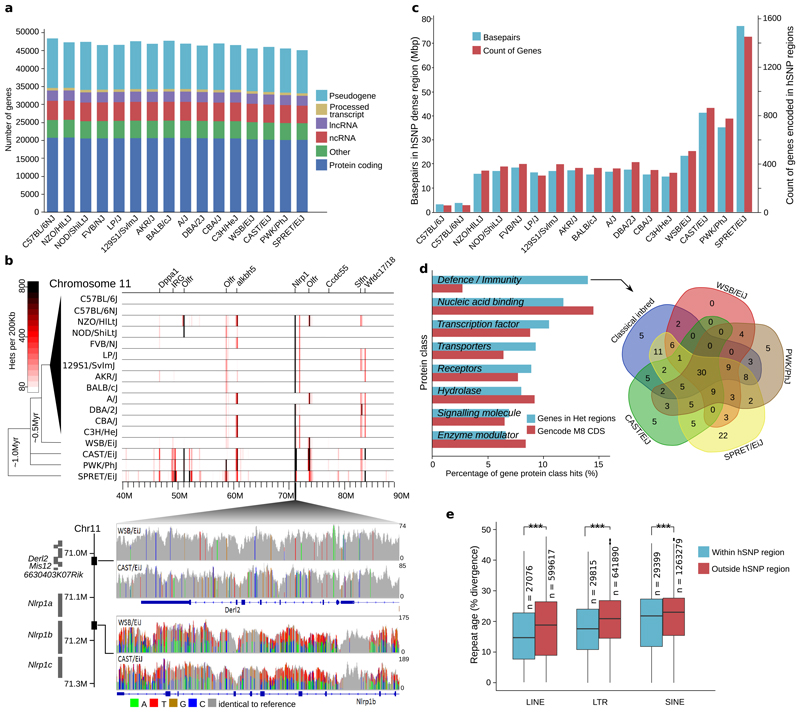
Figure 1. Genome annotation and content of strain specific haplotypes.
(a) Summary of the strain specific gene sets showing the number of genes broken down by GENCODE biotype. (b) Heterozygous SNP density for a 50Mbp interval on chromosome 11 in 200Kbp windows for 17 inbred mouse strains based on sequencing read alignments to the C57BL/6J (GRCm38) reference genome (top). Labels indicate genes overlapping the most dense regions. SNPs visualized in CAST/EiJ and WSB/EiJ for 71.006-71.170Mbp on GRCm38 (bottom), including Derl2, and Mis12 (upper panel) and Nlrp1b (lower panel). Grey indicates the strain base agrees with the reference, other colours indicate SNP differences, and height corresponds to sequencing depth. (c) Total amount of sequence and protein coding genes in regions enriched for heterozygous SNPs (relative to the GRCm38 reference genome) per strain. (d) Top PantherDB categories of coding genes in regions enriched for heterozygous SNPs based on protein class (left). Intersection of genes in the defence/immunity category for the wild-derived and classical inbred strains (right). (e) Box plot of sequence divergence (%), for LTRs, LINEs and SINEs within and outside of heterozygous dense regions. Sequence divergence is relative to a consensus sequence for the transposable element type (n=number of repeats in GRCm38, *** indicated p<0.001 using Welch’s two sample t-test. Box plots show 25th and 75th percentiles, and the median value).

