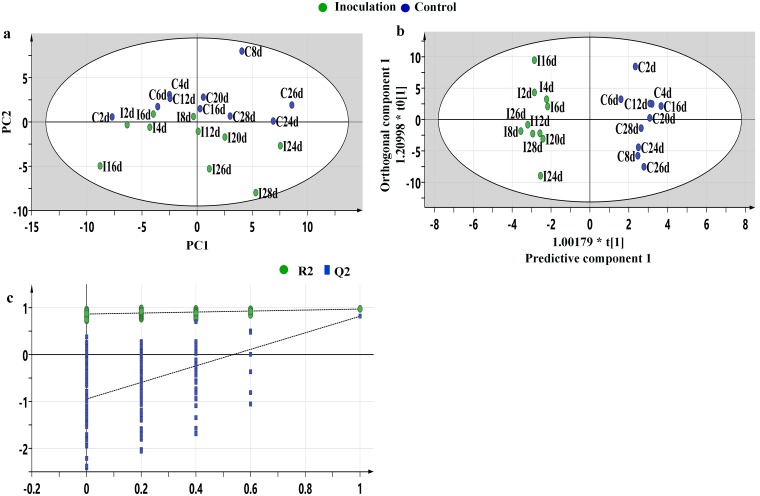
Fig 2. Multivariate statistical analysis of control samples and infected samples.
Principal component analysis (PCA) score plot for the inoculated samples (green) and control samples (blue) collected at 2, 4, 6, 8, 12, 16, 20, 24, 26 and 28 days, PC1 is 35.3% and PC2 is 17.2% (a); Orthogonal partial least-squares discriminant analysis (OPLS-DA) score plot (1+4 components), R2X(cum) = 0.739, R2Y(cum) = 1.000, Q2 = 0.817), R2X(cum) and R2Y(cum) are the cumulative modelled variations in the X and Y matrices, respectively, and Q2 value is a prediction error (b); Validation plots of the orthogonal partial least-squares discriminant analysis (POLS-DA) models acquired through 200 permutation tests for the control vs. inoculated groups. T [1] = scores for predictive component 1, to [1] = scores for orthogonal component 1. The ellipse shows the 95% confidence interval using Hotelling T2 statistics. R and Q were obtained after OPLS-DA permutation tests (n = 200), R2 intercept was 0.861, Q2 intercept was -0.933 (c).

