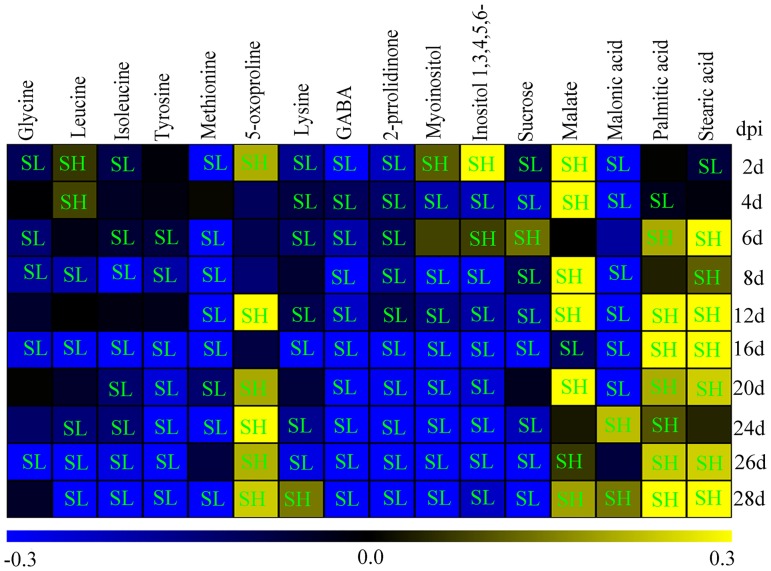
Fig 3. Heat map of significantly regulated metabolites in the alfalfa leaves between control and inoculated groups.
Metabolite levels in the leaves were shown as log10 ratios of values from infected versus uninfected groups at 2, 4, 6, 8, 12, 16, 20, 24, 26 and 28 days post inoculation (dpi). Yellow color shows upregulated compound levels, and the blue color indicates downregulated levels. Level of compounds in the inoculated leaves was significantly lower (SL) or significantly higher (SH) than in the control leaves. Inositol 1,3,4,5,6- is inositol 1,3,4,5,6-pentakisphosphate. Data were evaluated by student’s t test and p<0.05 has significant difference.

