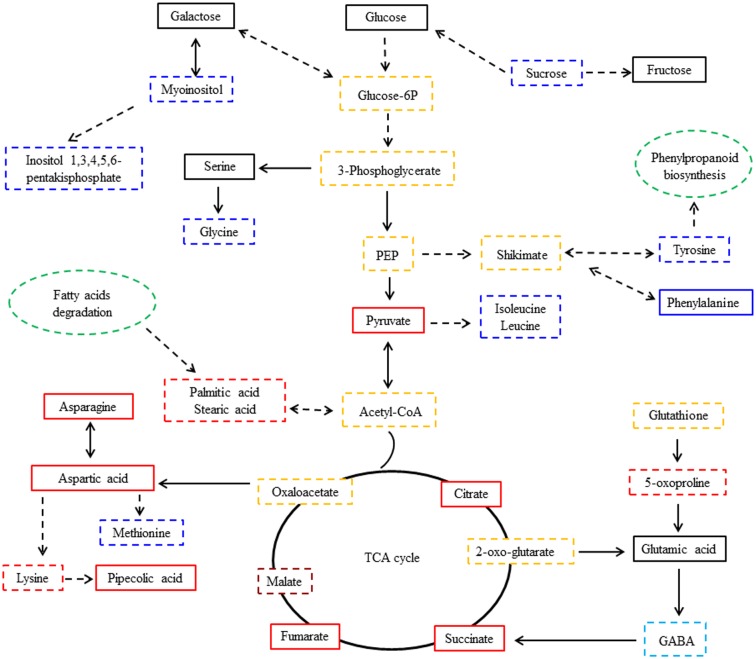
Fig 4. Metabolic pathway network of responsive metabolites in alfalfa leaves infected with P. medicaginis.
The black, red, blue, light blue and crimson full and dotted box indicates that metabolites were detected by GC-MS from the alfalfa leaves, and the dotted box presents significant regulated metabolites in the inoculated leaves compared with the controls (VIP>1.0 and p<0.05). Yellow dotted box indicates that the metabolites were not detected by GC-MS from the alfalfa leaves, but were involved in the corresponding pathway. Green dotted ovals indicates that the metabolic pathway was associated with the regulated metabolites. (VIP, the variable importance for the projection; PEP, phosphoenolpyruvate; TCA cycle, tricarboxylic acid cycle). Red color indicates that the compound was significantly upregulated at later infection stages. Blue color indicates that the compound was significantly downregulated at later infection stages. Light blue color indicates that the compound was significantly downregulated over time. Crimson color indicates that the compound was almost significantly upregulated over time.

