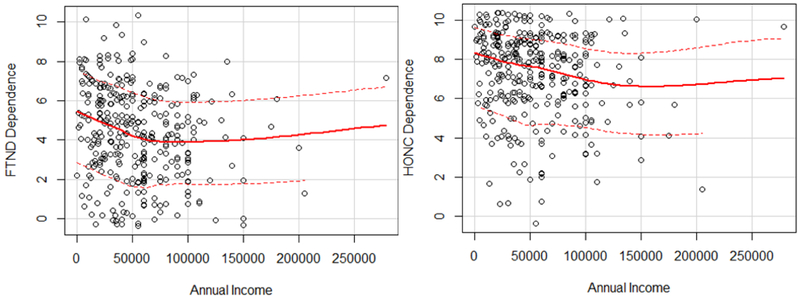
Figure 1.
Scatter plots of annual household income by FTND and HONC dependence. Each scatter plot includes a non-parametric regression line with loess smoothing (solid line) and lines of positive and negative squared residuals of the mean fit values (dashed lines). Points were jittered by a factor of 2.

