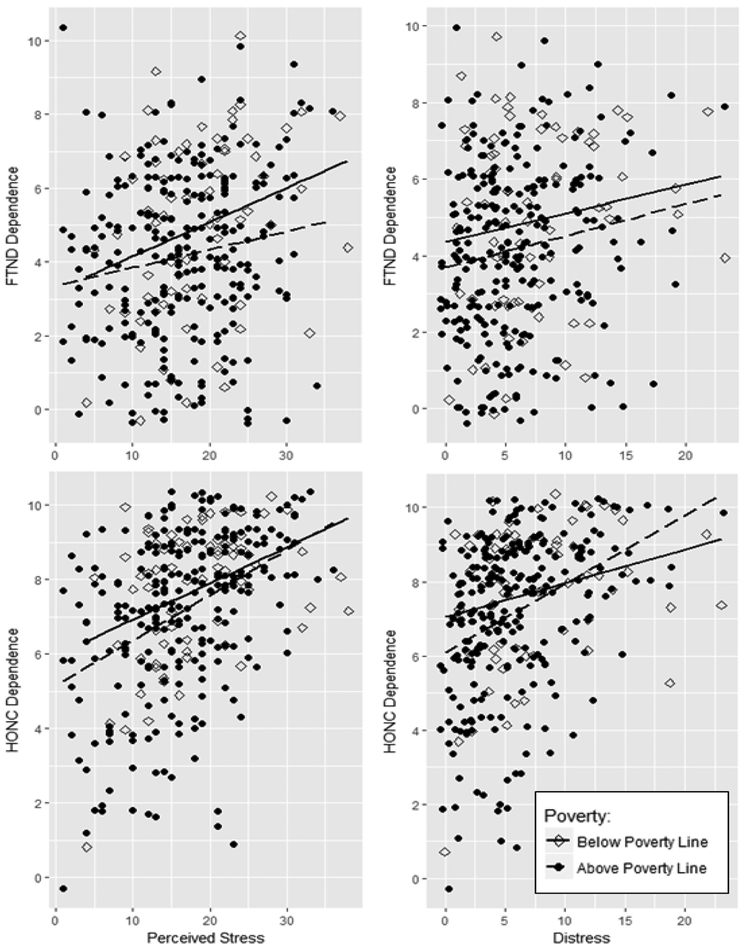
Figure 3.
Plots of the simple slopes of the associations between perceived stress or distress and dependence measured by the FTND or HONC. Slopes for participants below the poverty level are displayed with a solid line and those above the poverty level with a dashed line. Points were jittered by a factor of two.

