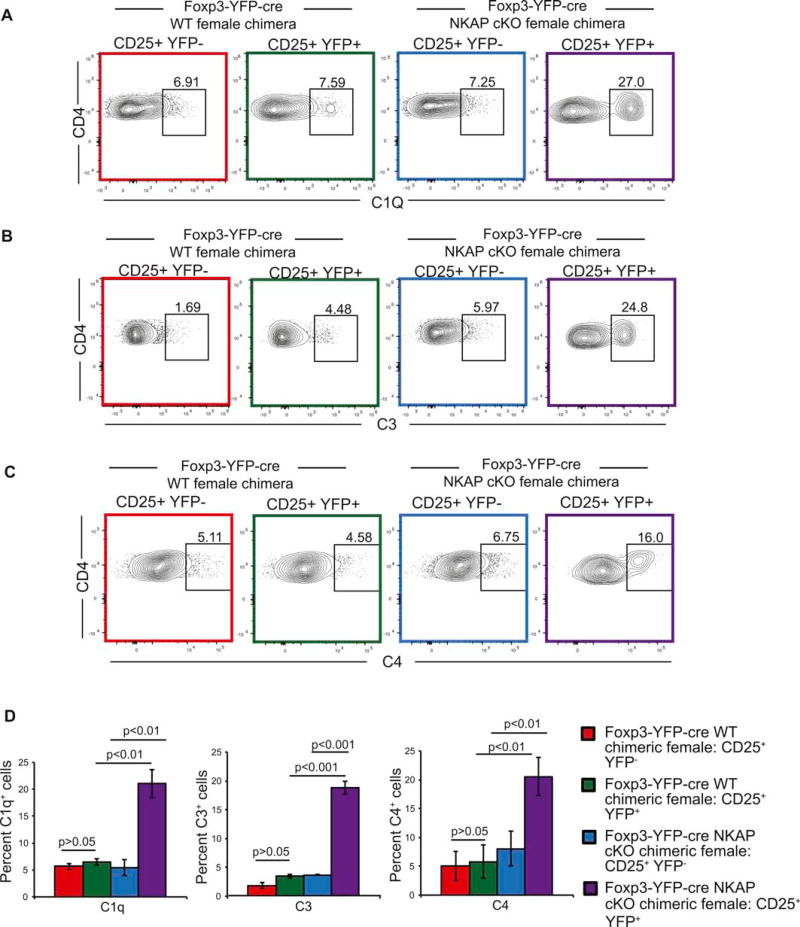
Figure 5. Tregs are opsonized by complement proteins.
(A–C) Increased deposition of complement components C1q (A), C3 (B) and C4 (C) on NKAP deficient Tregs. Data is from at least 3 independent experiments with at least 3 mice per group). (D) Enumeration of mean frequency of cells bound by complement. Data is from 3 independent experiments with 3 mice per genotype. Bar graphs are mean percent complement positive cells, and error bars are SEM. Throughout the figure, use of color to identify samples refers to gated populations in Figure 5(B).

