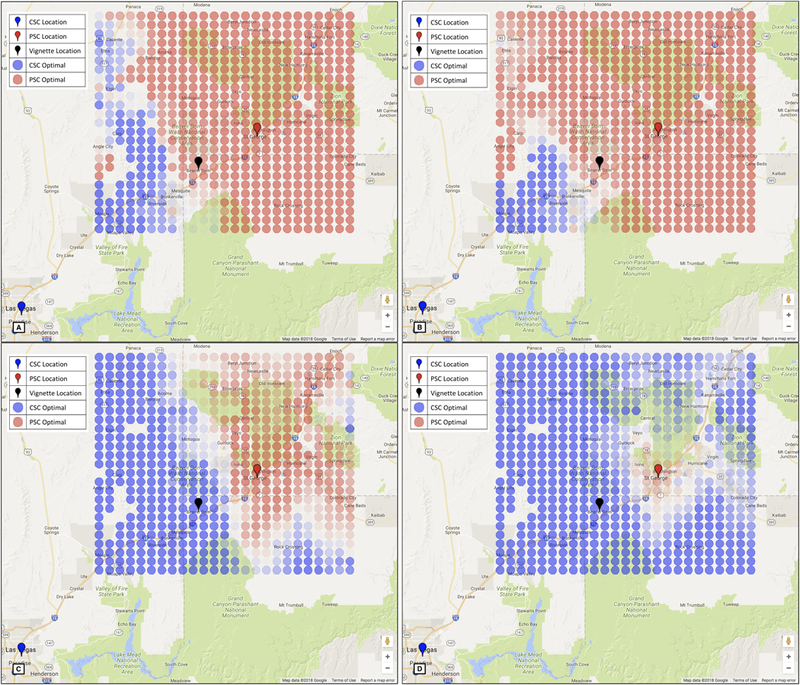
Figure 1:

Optimal strategies for a 65-year-old woman 10 minutes from symptom onset with RACE 3 (panel A) and RACE 8 (panel C) and 70 minutes from symptom onset with RACE 3 (panel B) and RACE 8 (panel D). Red circles indicate PSC is optimal and blue circles indicate CSC is optimal. More lightly shaded locations indicate less certainty in the optimal destination. Red markers show primary stroke centers, blue markers show comprehensive stroke centers, and the black marker indicates Beaver Dam, the vignette location. Map data are provided by Google.
