
Figure 2: Oral glucose tolerance test.
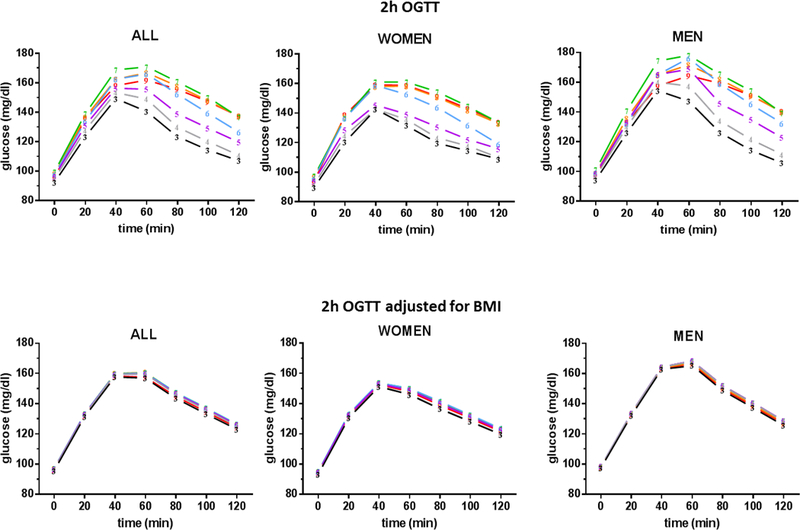
Top panel shows OGTT results in 2,777 nondiabetic participants from the Baltimore Longitudinal Study of Aging. Each line corresponds to one decade. Plasma glucose levels during OGTT rise consecutively for every decade of age until they peaked at the 7th decade. Men and women have similar patterns with men having more severe glucose intolerance. Bottom panel shows the OGTT results adjusted for body mass index (BMI).