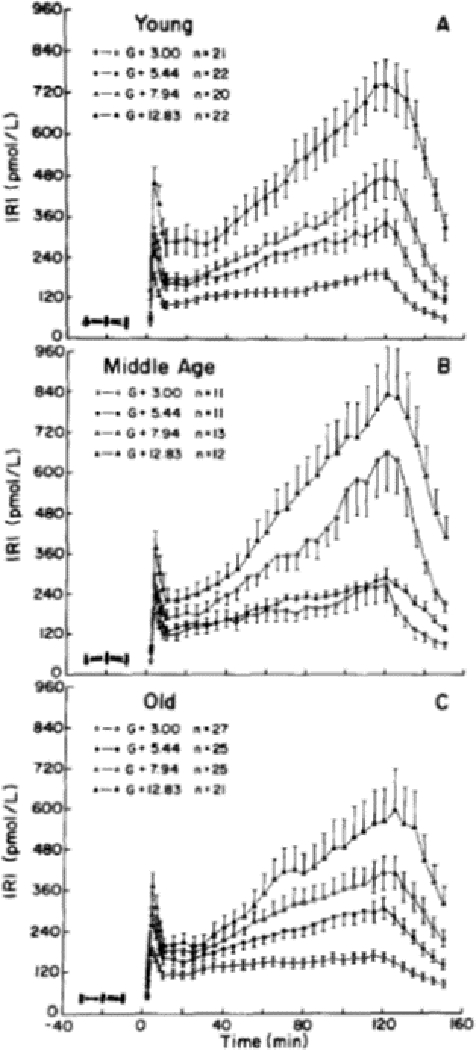
Figure 4:

Bimodal time course of the endogenous plasma insulin response during 2h hyperglycemic clamps at four different hyperglycemic plateaus: 54, 98, 142, 230 mg/dL above basal glucose levels. Top panel: young participants; middle panel: middle age participants; bottom panel: old participants (reprint with permission).70 There is a first-phase insulin secretion that occurs during the first 10 min with a peak response at ~4 min; then, plasma insulin level falls reaching a nadir at ~ 10 min; next, the second insulin secretion phase begins and insulin levels increase linearly until a plateau is reached. Within each age group, higher glucose doses corresponded with statistically higher insulin responses at all levels but differences in insulin responses among the age groups were not significantly different.
