
Figure 2. Focal cerebral ischemia increases the protein level and glycosylation of α2δ−1.
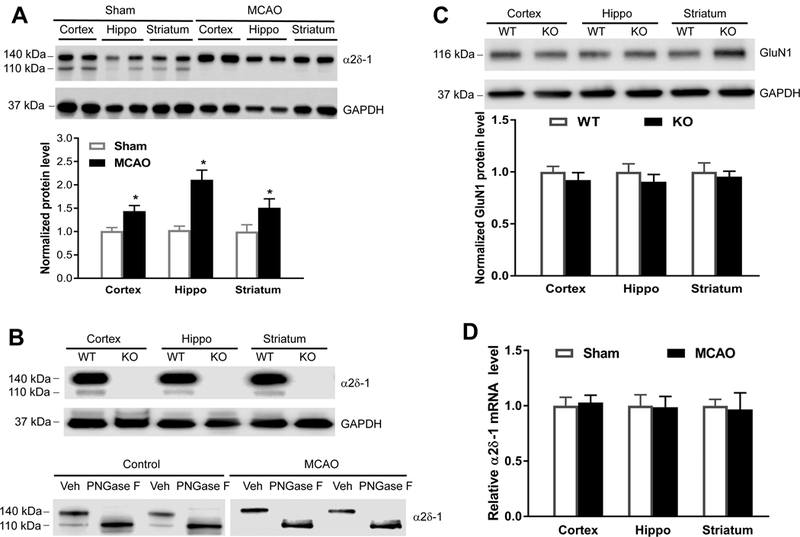
(A) Representative gel images and quantification of α2δ−1 protein levels in the cerebral cortex, hippocampus (Hippo), and striatum from sham control mice and mice subjected to 90 min of MCAO followed by 24 h of reperfusion (n = 8 mice per group). (B) Upper: Representative gel images of α2δ−1 protein bands in different regions of brain tissues from wild-type (WT) and Cacna2d1 knockout (KO) mice; Lower: α2δ−1 protein bands detected in 2 sets of cortical tissue lysates from control and MCAO mice treated with PNGase F or vehicle (Veh). (C) Original gel images and quantification of GluN1 protein levels in brain tissues from WT and Cacna2d1 KO mice (n = 8 mice per group). (D) Quantification of α2δ−1 mRNA levels in the cerebral cortex, hippocampus (Hippo), and striatum in MCAO and sham control mice (n = 6 mice per group). Data are shown as means ± SEM. *p < 0.05 compared with the sham group in the corresponding brain region.