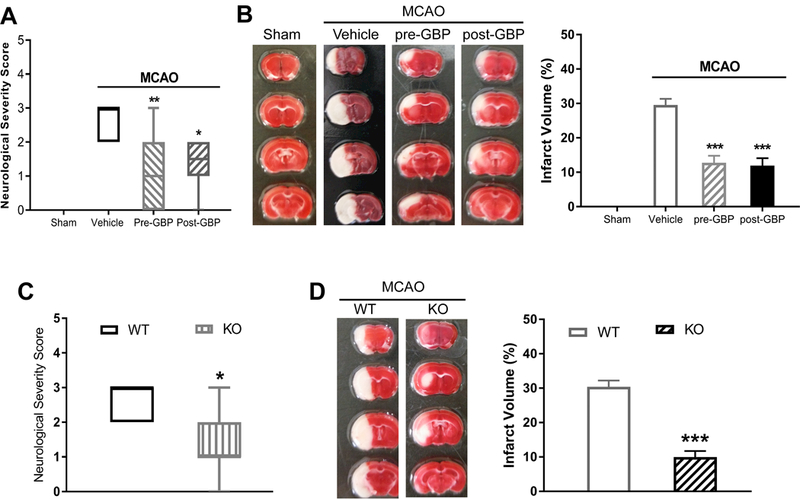
Figure 3. α2δ−1 critically contributes to brain injury and neurological deficit caused by MCAO.

(A) Neurological deficit scores shown in a box-whisker plot in sham control mice (n = 8 mice) and MCAO mice treated with vehicle (n = 9 mice), gabapentin before MCAO (pre-GBP, n = 10 mice), or gabapentin after MCAO (post-GBP, n = 8 mice). (B) Representative TTC staining and quantification of brain infarct volume in sham control mice (n = 8 mice) and MCAO mice treated with vehicle (n = 9 mice), gabapentin before MCAO (n = 10 mice), or gabapentin after MCAO (n = 8 mice). (C) Neurological deficit scores shown in a box-whisker plot in Cacna2d1 knockout (KO) mice and wild-type (WT) mice subjected to MCAO and reperfusion (n = 8 mice per group). (D) Representative TTC staining and quantification of brain infarct volume in Cacna2d1 KO and WT mice (n = 8 mice per group). Data are shown as means ± SEM (neurological deficit score data shown as median ± min-max). *p < 0.05, **p < 0.01, ***p < 0.001 each compared with the vehicle MCAO or WT control group.
