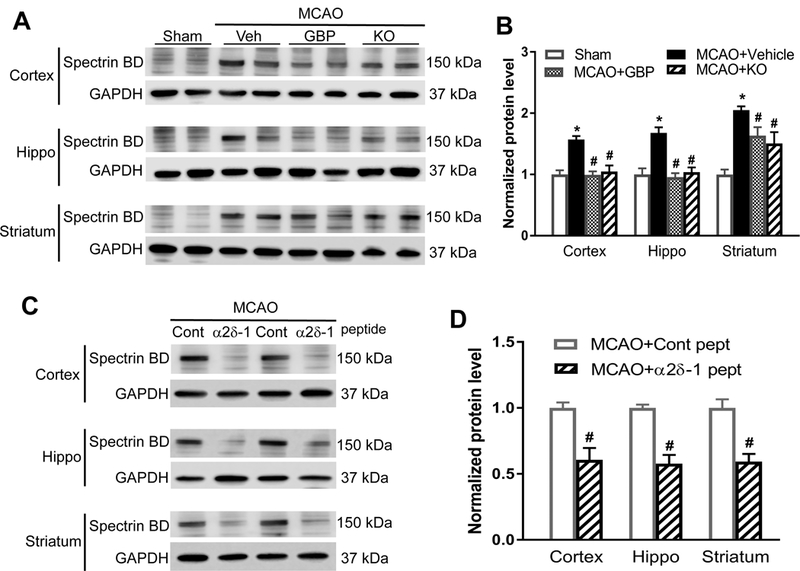
Figure 5. Gabapentin, α2δ−1Tat peptide, or α2δ−1 genetic deletion reduces MCAO-induced calpain activity in brain tissues.

(A and B) Original gel images (A) and quantification (B) of spectrin BD levels in the cerebral cortex, hippocampus (Hippo), and striatum from sham control mice, MCAO mice treated with vehicle (Veh) or gabapentin (GBP), and Cacna2d1 knockout (KO) MCAO mice (n = 8 mice per group). (C and D) Original blotting images (C, two pairs of samples) and quantification (D) of spectrin BD levels in the cerebral cortex, hippocampus, and striatum from MCAO mice treated with α2δ−1Tat peptide or control peptide (n = 8 mice per group). Data are shown as means ± SEM. *p < 0.05 compared with the sham group. #p < 0.05 compared with MCAO+vehicle group or control peptide group in the same brain region.
