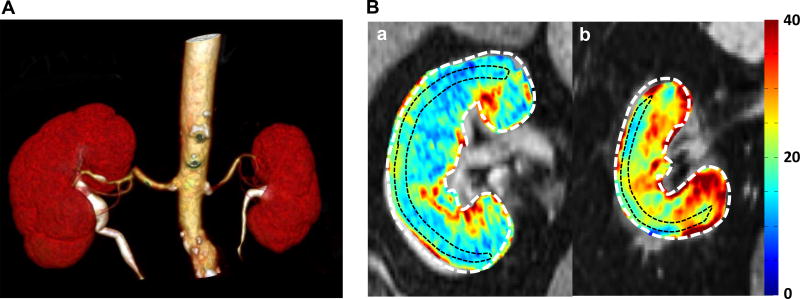
Figure 1.
(A) Computed tomography (CT) angiogram with a renal artery stenosis in left kidney. 3D-CT angiography shows left renal artery stenosis in the proximal portion. The left kidney has smaller volume than that of right kidney. (B) Representative T2* images and R2* parametric maps for subjects with essential hypertension (EH) (a) or renovascular hypertension (RVH) (b) obtained using the same color scale for R2*. Red areas represent hypoxic regions. Fractional hypoxia >30/s in RVH was greater than in EH (29.8% vs 12.1%).

