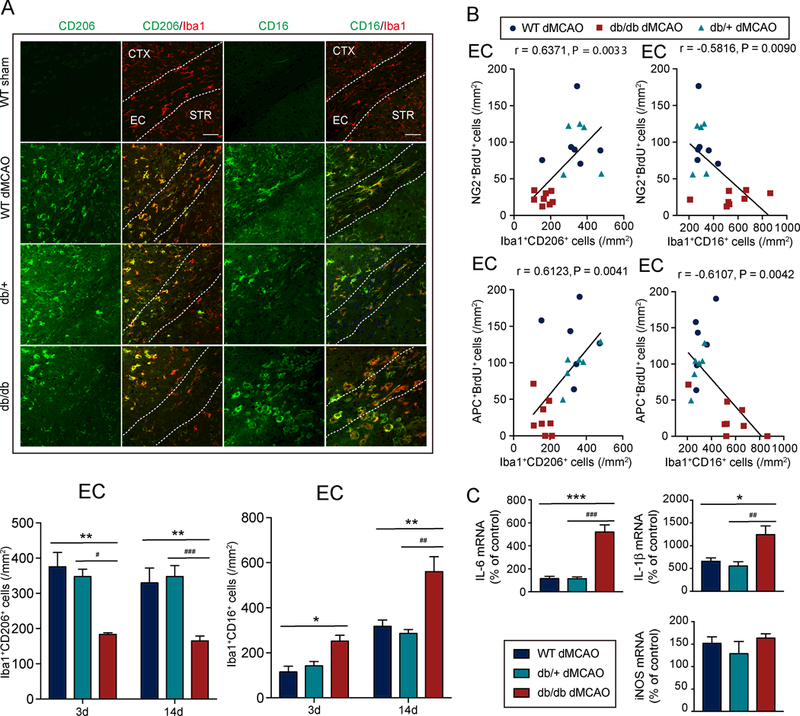
Figure 5. Diabetic mice exhibit enhanced M1-like inflammatory microglia/macrophage responses, which are associated with impaired oligodendrogenesis.

A, Upper: Representative images of Iba1 and CD16 or CD206 double-immunostaining in the external capsule (EC), cortex (CTX), and striatum (STR) of WT mice, db/+ mice, or db/db mice 14d after dMCAO. Scale bar: 40 μM. Lower: Quantification of the number of CD206+Iba1+ M2-like microglia/macrophages and CD16+Iba1+ M1-like microglia/macrophages in the peri-infarct area in the EC 3d and 14d after dMCAO. Three days after dMCAO: n=3–4/group, 14d after dMCAO: n=5–8/group. B, Pearson correlation between the number of BrdU+NG2+ OPCs or BrdU+APC+ oligodendrocytes and the number of CD16+Iba1+ M1-like microglia/macrophages or CD206+Iba1+ M2-like microglia/macrophages in the EC 14d after dMCAO. C, mRNA expression of inflammatory mediators (IL-1β, IL-6, and iNOS) in the ischemic brains of db/db mice, db/+ mice, and WT mice was measured at 14d after dMCAO using RT-PCR. n=4/group. Data are % of corresponding contralateral brains. *p<0.05, **p<0.01, ***p<0.001, WT vs. db/db; #p<0.05, ##p<0.01, ###p<0.001, db/+ vs. db/db; one-way ANOVA followed by Bonferroni’s posthoc.
