Fig. 4.
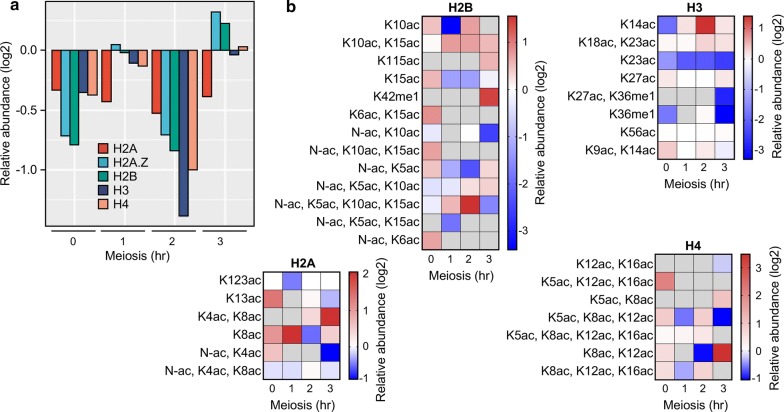
Differences in abundance of histone subunits and histone PTMs at hotspot and basal control in meiosis. Protein abundance was from iBAQ values; precursor intensity values for histone peptides with and without modifications were used to quantify the abundance of histone PTMs. a Relative abundance of histone subunits; negative (log2) values indicate reduction in histone occupancy within hotspot MiniCs relative to basal control MiniCs. b Relative abundance of all histone PTMs detected; gray cells indicate that the modified peptide was not detected in one or both samples (hotspot or control). Note that the majority of peptides with a PTM harbor multiple PTMs, revealing combinatorial complexity not detectable by ChIP

