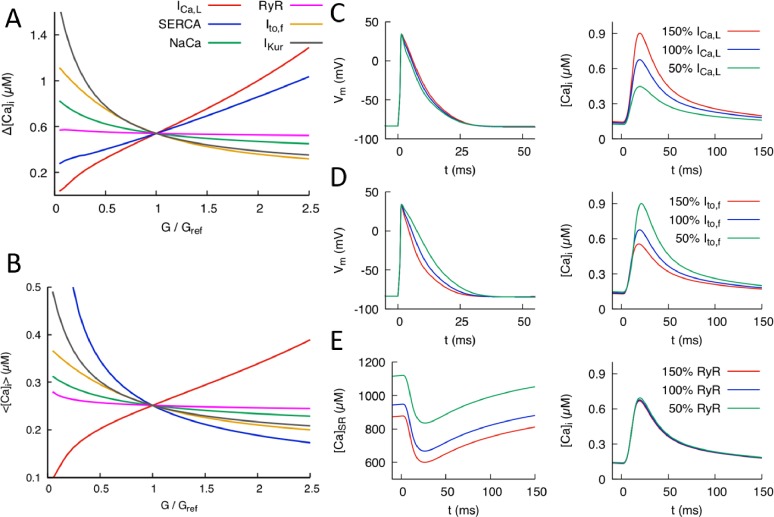
Figure 2. Effects of individual conductances on the Ca2+ transient (CaT).
(A) CaT amplitude defined as the difference between the peak and diastolic values of the cytosolic Ca2+ concentration versus G/Gref where G is the individual conductance value and Gref some fixed reference value. (B) Time-averaged over one pacing period () versus G/Gref. Illustration of the effect of varying conductance (C) and conductance (D) on AP and CaT profiles, where 50%, 100%, and 150% correspond to Gref=0.5, 1.0, and 1.5, respectively. (E) Effect of varying RyR conductance on SR Ca2+concentration and CaT. Different time windows are plotted for the CaT and SR load (0 to 150 ms) and AP waveforms (0 to 50 ms) in (C-–E).

