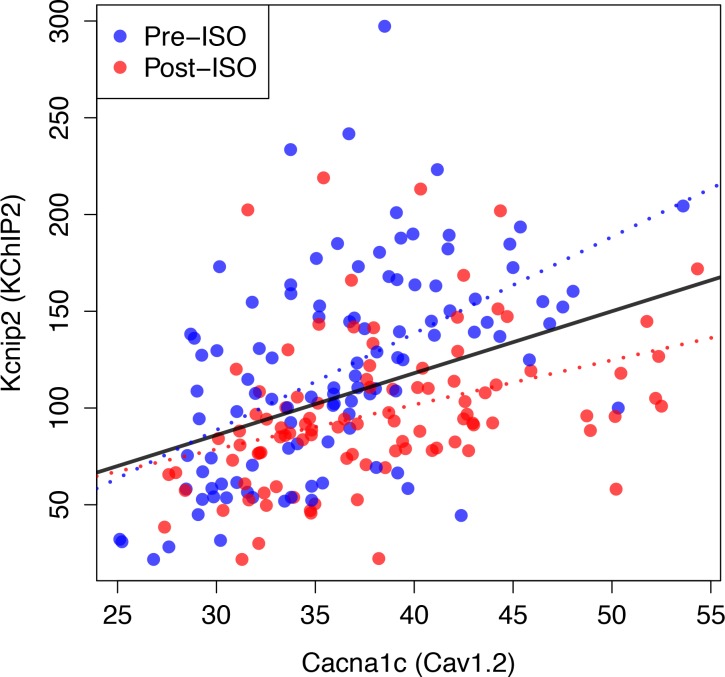
Figure 7. Compensation and gene expression.
Plot showing the existence of a statistically very significant correlation (Pearson correlation coefficient and p-value, ) between the expression level of Kcnip2, encoding the KChIP2 accessory subunits that interact with Kv4.2 channels () and of Cacna1c, a gene encoding the 1C subunit of the Cav1.2 L-type calcium channels () across 206 mice. Cardiac gene expression was measured in control (Pre-ISO) strains and 21 days after injection of isoproterenol (post-ISO) in 100 HMDP strains (a smaller number due to higher mortality of certain strains). Note that the significant correlation holds when considering separately pre-ISO (blue points, , ) and post-ISO (red points, , ) data. Lines show best fits of a linear model for pre-ISO (blue), post-ISO (red), and pre- and post-ISO combined (black). Expression data is taken from Santolini et al. (2018) and is averaged over all microarray probes for each gene.

