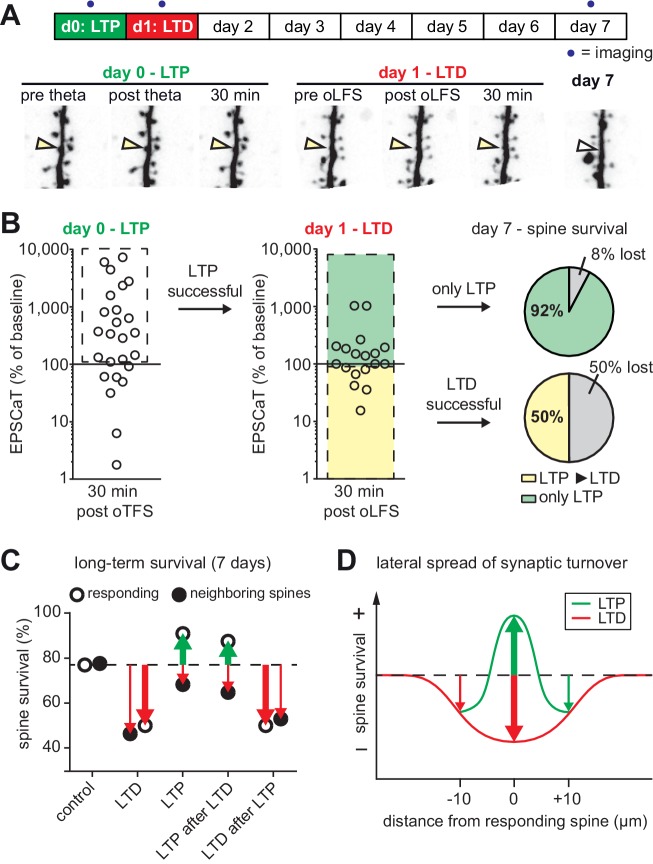
Figure 5. with one supplement: The most recent plasticity event fully accounts for synaptic tenacity.
(A) Long-term survival analysis of experiments where LTD was induced 24 hr after LTP. Maximum intensity projections of mCerulean fluorescence in dendritic segment harboring a responding spine that was successfully potentiated on day 0 and depressed on day 1 (yellow arrowhead). (B) Assessment of synaptic weight changes induced by oTFS on day 0 and oLFS on day 1. Dashed box in left graph indicates all experiments where LTP was successfully induced on day 0. Only these spines were considered in the LTD experiment on day 1 (middle). Yellow shaded box indicates all experiments where LTD was successfully induced on day 1 (after LTP on day 0, LTP ► LTD). Note the low probability of depression after potentiation. Green shaded box encompasses experiments where oLFS did not lead to LTD or even led to LTP (only LTP). Pie charts show quantification of spine survival after 7 days for these two conditions. (C) Comparison of spine survival 7 days after various plasticity paradigms. Stimulated spines are shown as open circles; non-stimulated neighbors within 10 µm are shown as filled circles. Values for ‘control’ and ‘LTD’ are from Wiegert and Oertner, 2013. (D) LTP stabilizes the spine carrying the potentiated synapse, but reduces the average lifetime of more distant (>5 µm) spines on the same dendrite.


