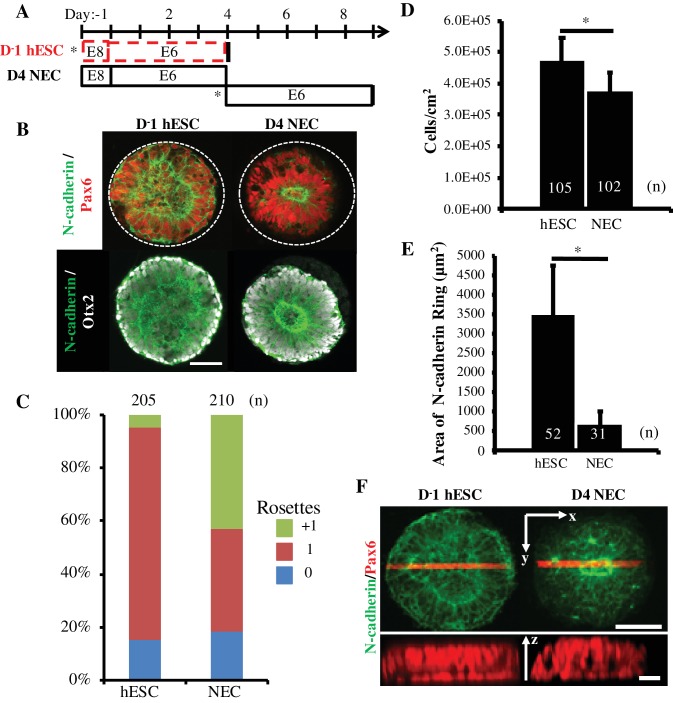
Figure 3. Comparison of Rosette Emergence in D-1 hESC vs D4 NEC micropatterned tissues.
(A) Schematic of micropatterned tissue derivation for D-1 hESCs and D4 NECs; sub-culture/seeding onto micropatterned substrates indicated by (*). (B) Representative immunostained images of forebrain, micropatterned neuropithelial tissues. (C) Manual quantification of polarization foci/neural rosettes per tissue with the number of tissues (technical replicates) analyzed per condition indicated above each bar. (D) Average cell density and (E) area of polarized N-cadherin ring within micropatterned neuroepithelial tissues derived from D-1 hESCs and D4 NECs. Number of tissues analyzed per condition indicated on each bar, and error bars represent standard deviation. (*) indicates a significance of p<0.05 calculated using a One-way ANOVA. (F) Representative confocal Z-stack images of micropatterned neuroepithelial tissues (top) with profile view of red highlighted region (bottom). Scale bars are (B, F-top) 100 μm and (F-bottom) 10 μm.

