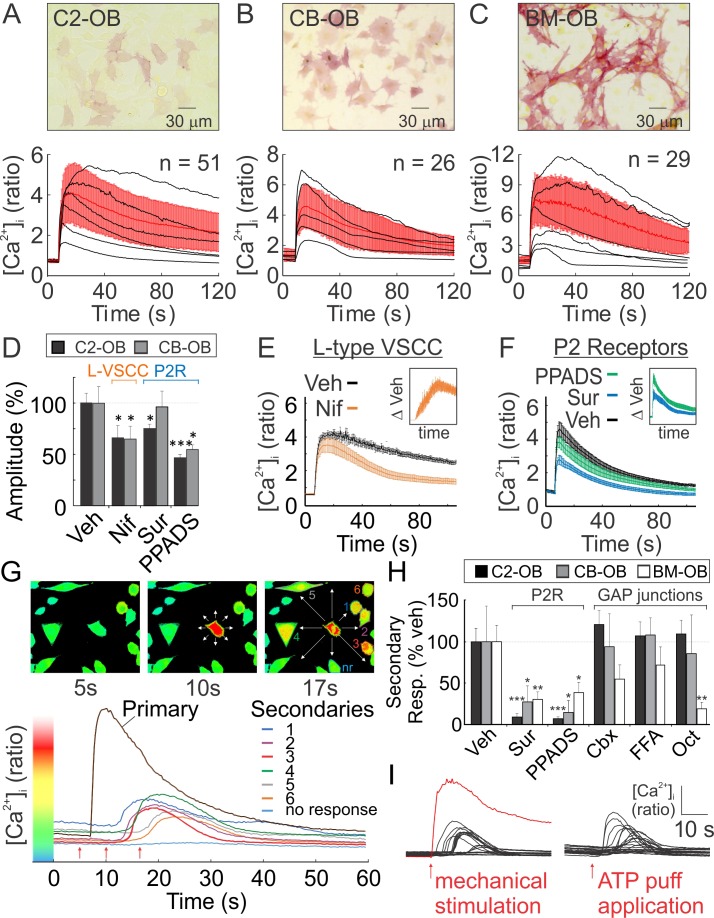
Figure 1. Osteoblasts are mechanosensitive.
(A-C) Single Fura2-loaded C2-OB (A), CB-OB (B) or BM-OB (C) (Top: ALP staining) were stimulated with micropipette and [Ca2+]i was recorded (Figure 1—video 1). Bottom: representative traces (black), means ± SEM (red) (D) Amplitudes of mechanically evoked [Ca2+]i transients in osteoblasts pretreated with vehicle, Nif, Sur or PPADS (see Materials and methods for abbreviations, targets and doses). Means ± SEM, n = 6–15 stimulated cells, normalized to vehicle. (E, F) Contribution of L-type VSCC (E, n = 10) and P2 receptors (F, n = 12) to mechanically evoked [Ca2+]i transients in C2-OB as comparison and difference (insets) of mean ±SEM of vehicle and treatment [Ca2+]i transients. (G) [Ca2+]i in the stimulated (primary) and neighboring (secondary) C2-OB. Top: pseudocolor of 340/380 ratio, white arrows: directions of signal propagation, bottom: [Ca2+]i transients, red arrows: top panel time points. (H) Secondary responsiveness in cultures pretreated with vehicle, Sur, PPADS, Cbx, FFA or Oct. Means ± SEM, n = 7–21 stimulated primary responses, normalized to vehicle. (H) [Ca2+]i transients induced by mechanical stimulation of single C2-OB (left, red curve) or puff application of 10 µM ATP (right). For Figure 1, *significance between treatment and control by ANOVA. Source data for Figure 1 is provided in Figure 1—source data 1.

