
Figure 2. ATP release following mechanical stimulation of a single osteoblast.
(A) Fura2-loaded C2-OB bathed in luciferin/luciferase containing PS was micropipette-stimulated. Top: 380 ex/510 em images before (a) and after (b) stimulation of the cell (red outline). Bottom: intracellular (IC) Fura2 fluorescence [Ifura2] of primary (red) and secondary (orange) responders and extracellular (EC) luciferin fluorescence [Iluciferin] (green). (B) Box plot of [ATP]e in pericellular region of stimulated C2-OB, black markers: independent observations, n = 13 stimulated cells. (C) Correlation between [ATP]e and percentage of secondary responders observed in C2-OB (n = 20 stimulated primary responses), dashed line: linear regression. Source data for Figure 2 is provided in Figure 2—source data 1.
Figure 2—source data 1.
elife-37812-fig2-data1.xlsx (1.2MB, xlsx)
DOI: 10.7554/eLife.37812.008
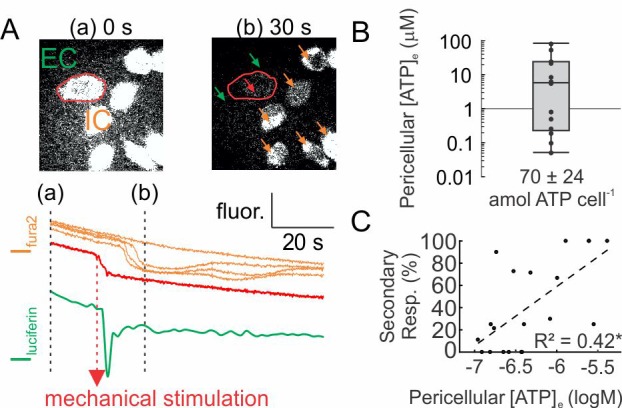
Figure 2—figure supplement 1. Real-time ATP measurement assay using fluorescent properties of luciferin-luciferase.

(A) 1 µM ATP was added to luciferin in presence or absence of luciferase and fluorescence was recorded at 380 ex/510 em. Data were normalized to basal luciferin fluorescence. (B) [ATP]e dose dependence of luciferin-luciferase fluorescence change from baseline. Means ± SEM, n = 3 independent recordings, dashed line: linear regression, ***p<0.001.