. 2018 Oct 16;7:e37812. doi: 10.7554/eLife.37812

Figure 3. Vesicular ATP released upon mechanical stimulation is not the primary source of extracellular ATP.

(A) Confocal images of CB-OB loaded with quinacrine and MANT-ATP, Figure 3—video 1-2. (B) Changes in quinacrine-loaded CB-OB treated with ionomycin (left) or stimulated with micropipette (right, region of interest in white). (C) Vesicular release event in CB-OB (top) coincides with a sudden drop in granular quinacrine fluorescence (bottom), Figure 3—video 3-5.(D) Kinetics of vesicular release from CB-OB stimulated by micropipette at 0 s, n = 37 stimulated cells. (E–H) Quinacrine- (E, F) or Fura2- (G, H) loaded CB-OB were pre-treated (10 min) with vehicle, ionomycin (iono) or NEM or placed in [Ca2+]-depleted physiological solution, and micropipette-stimulated when indicated (+). Vesicular density (E) and cumulative release (F), secondary responsiveness (G) and [Ca2+] response activation rates (H) were determined, n = 7–37 primary cells. (I) tFSS was applied by replacing 50% media volume n times. (J, K) ATP released per cell (left axis) or as percent of cellular ATP content (right axis) was measured following CB-OB stimulation by tFSS (J, black dashed line: rational function fit; red dashed line: corresponding asymptote) or after indicated pre-treatments followed by tFSS (K, 10x media displacements, +), n = 6–8 independent cultures. For Figure 3, means ± SEM, *significance compared to vehicle (E–H), basal ATP release (J) or to tFSS-stimulated vehicle (K) by ANOVA. Source data for Figure 3 is provided in Figure 3—source data 1.

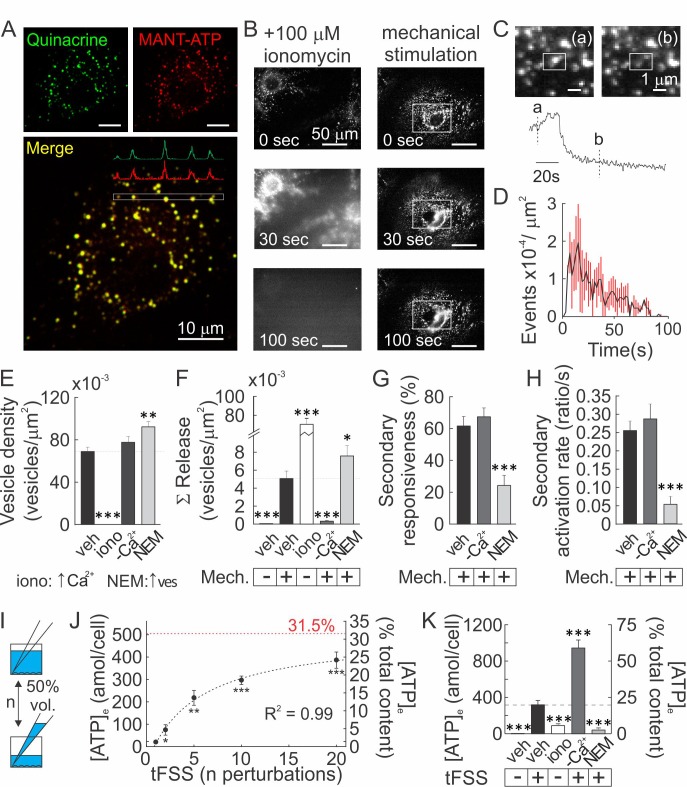
Figure 3—source data 1.
DOI: 10.7554/eLife.37812.017

Figure 3.

Figure 3—figure supplement 1. Involvement of conductive channels in osteoblast response to mechanical stimulation.

Figure 3—figure supplement 1.

(A) Amplitudes of mechanically evoked [Ca2+]i transients in osteoblasts pretreated with vehicle, Gd3+, FFA, GSK, HC, Nif, ML, Sur and PPADS. Means ± SEM, n = 5–15 stimulated cells, normalized to vehicle. (B) CB-OB cells were stimulated by tFSS (10x) following pre-treatment with conductive channel inhibitors Gd3+, GSK, HC, Nif, ML, A7, PPADs and GsM. Means ± SEM attomoles ATP released per cell over 60 s after stimulation, n = 6–8 separate cultures, compared to vehicle. *p<0.05. **p<0.01 and ***p<0.001 indicate significance of treatment condition compared to vehicle, assessed by ANOVA followed by post-hoc Bonferroni test.
Figure 3—video 1. Confocal Z-stack of quinacrine- (left) and MANT-ATP (middle)-loaded CB-OBcells with merged images (right), ex. 1.
Download video file (240.9KB, mp4)
DOI: 10.7554/eLife.37812.011
Figure 3—video 2. Confocal Z-stack of quinacrine- (left) and MANT-ATP (middle)-loaded CB-OB cells with merged images (right), ex. 2.
Download video file (348.2KB, mp4)
DOI: 10.7554/eLife.37812.012
Figure 3-—video 3. Single quinacrine-loaded CB-OB was stimulated with micropipette and vesicular release events were recorded, ex. 1.
Download video file (928.6KB, mp4)
DOI: 10.7554/eLife.37812.014
Figure 3—video 4. Single quinacrine-loaded CB-OB was stimulated with micropipette and vesicular release events were recorded, ex. 2.
Download video file (2.3MB, mp4)
DOI: 10.7554/eLife.37812.015
Figure 3—video 5. Single quinacrine-loaded CB-OB was stimulated with micropipette and vesicular release events were recorded, ex. 3.
Download video file (446.8KB, mp4)
DOI: 10.7554/eLife.37812.016