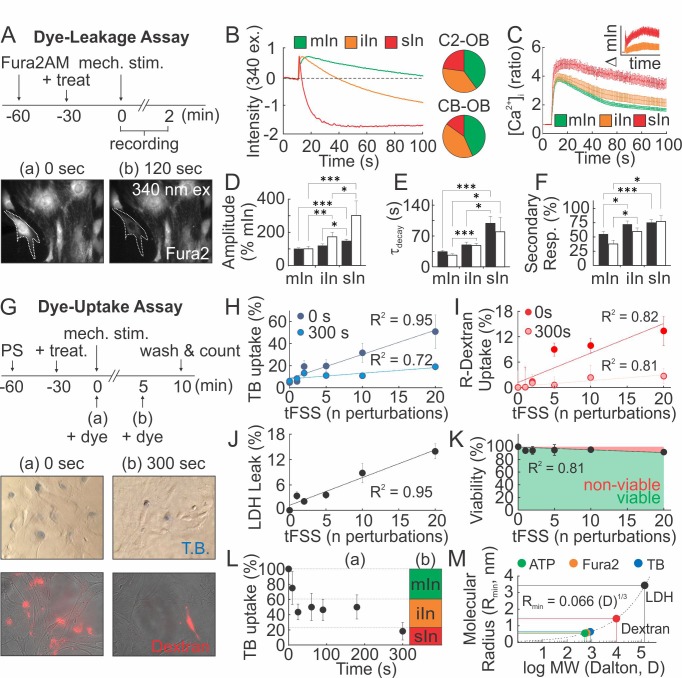
Figure 4. Mechanical stimuli regularly and reversibly compromise the integrity of osteoblast cell membrane.
(A–F) Membrane permeability in micropipette-stimulated Fura2-loaded osteoblasts. (A) Top: Schematic of dye-leakage assay. Bottom: 340 ex/510 em before (a) and after (b) CB-OB stimulation (white outline). (B) Representative Fura2 traces in C2-OB with minor (mIn), intermediate (iIn) or severe (sIn) cell injury and relative occurrence frequency (right, n = 35–40 stimulated cells). (C) C2-OB [Ca2+]i responses and differences (inset) for mIn (green), iIn (orange) and sIn (red), n = 8–14 stimulated cells. (D–F) Primary [Ca2+]i response amplitudes (D) and decay constants (E), and secondary responsiveness (F) in CB-OB (black; n = 40 stimulated cells) or C2-OB (white; n = 35 stimulated cells), grouped by cell injury status. (G–K) Membrane permeability in tFSS-stimulated osteoblasts. (G) Top: schematic of dye-uptake assay. Bottom: CB-OB stained with TB (top) or R-dextran (bottom) prior to (0 s, left) or after (300 s, right) tFSS application (10x). Uptake of TB (H) or R-dextran (I) added prior to (0 s) or after (300 s) tFSS stimulation of CB-OB (n = 4 independent cultures). (J) Leakage of LDH from CB-OB 5 min after tFSS (n = 8 independent cultures, normalized to total LDH). (K) Viability of C2-OB 1 hr after tFSS assessed by alamarBlue (n = 8–16 independent cultures). (L) Uptake of TB added at indicated times after micropipette-stimulation of C2-OB (L-a, n = 4–23 stimulated cells) compared to relative frequencies of mIn, iIn and sIn assessed by Fura2-leakage assay (L-b). (M) Calculated minimum membrane lesion radius Rmin required for permeability to LDH, R-dextran, TB, Fura2 and ATP. For Figure 4, means ± SEM, dashed lines: linear regression, *significance by ANOVA. Source data for Figure 4 is provided in Figure 4—source data 1.


