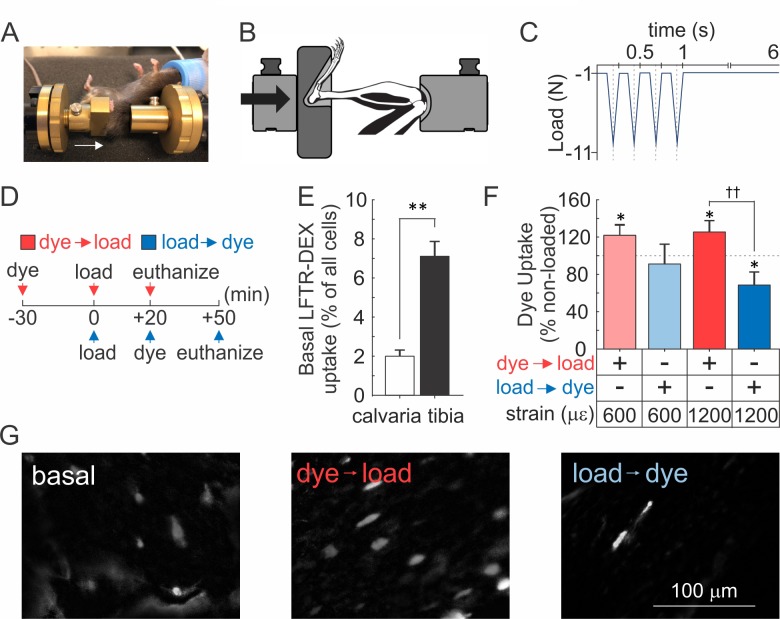
Figure 5. Osteocyte membranes are reversibly disrupted during in vivo cyclic compressive loading of the tibia.
(A, B) Left tibia of anesthetized mouse was positioned in loading device as shown in picture (A) and schematic (B). Arrows indicate direction of load. (C) The triangle waveform included 0.15 s symmetric active loading/unloading, with a 0.1 s rest phase (−1 N) between load cycles and a 5 s rest inserted between every four cycles. A maximum force of −5.5 N or −11 N was applied, which engenders 600 µε or 1200 µε, respectively at the periosteal surface of the tibia mid-diaphysis in these mice. (D) Experimental design schematic: animals were injected with LFTR-Dex 30 min before (red) or 20 min after (blue) in vivo cyclic tibial loading (5 min). (E) Proportion of cells exhibiting LFTR-Dex uptake in calvariae (n = 5 animals) and control tibiae (n = 20 from 10 animals), normalized to average total cell number, means ± SEM, **p<0.01. (F) Dye uptake in tibia injected before (red) or after (blue) loading at 600 µε or 1200 µε, means ± SEM, n = 5/strain/dye protocol, normalized to non-loaded contralateral tibia, *significance compared to non-loaded tibia, ††significance between dye protocols, by ANOVA. (G) Contrast enhanced images of dye uptake in control (left), and 1200 µε loaded tibia injected with dye before (middle) or after (right) loading. Source data for Figure 5 is provided in Figure 5—source data 1.


