. 2018 Oct 16;7:e37812. doi: 10.7554/eLife.37812

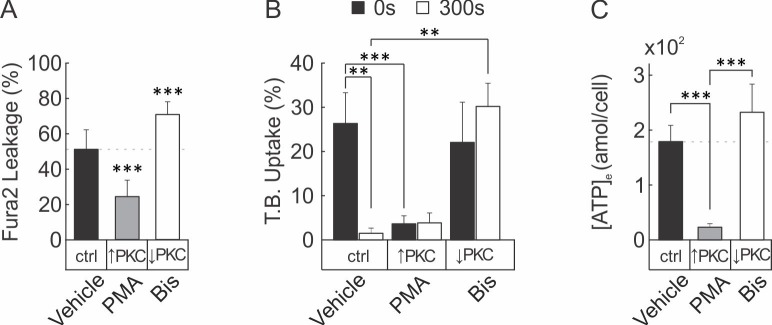
Figure 6. Membrane resealing depends on PKC-regulated vesicular exocytosis.

(A–D) CB-OB were pretreated with vehicle, PMA or Bis, and membrane injury (A, B) vesicular exocytosis (C) and ATP release (D) were assessed. (A) TB uptake at 0 and 300 s after tFSS (10x), n = 5–8 independent cultures. (B) Fura2 leakage, determined as percentage of sIn cells after micropipette-stimulation, n = 9–16 stimulated cells. (C) Cumulative vesicular release over 100 s after micropipette-stimulation, n = 6–10 stimulated cells. (D) ATP release over 60 s following 10x tFSS stimulation, n = 8 independent cultures. (E) Immunoblotting for PKC isoform phosphorylation in CB-OB treated with vehicle, PMA or Bis (30 min); or 30 s, 90 s or 300 s after tFSS (10x). Shown are immunoblots (left), complete gels in Figure 6—figure supplement 4, and densitometry (right) of phosphorylated and total conventional (pPKC pan), atypical (pPKC ζ/λ), novel (pPKC δ/θ), and PKD/PKCµ isoforms. Phosphorylated PKC isoforms were normalized by total PKC levels and reported relative to vehicle, n = 3 independent cultures. (F–H) Relationships between vesicular release (pooled data from vesicular release experiments), membrane disruption (pooled from membrane integrity experiments) and ATP release (pooled from 10x tFSS experiments) following mechanical stimulation of CB-OB, solid line - regression. For Figure 6, data are means ± SEM, *significance compared to vehicle (0 s vehicle for A), significance compared to 300 s vehicle (A) and #significance of indicated comparisons (A), by ANOVA or by regression. Source data for Figure 6 is provided in Figure 6—source data 1.

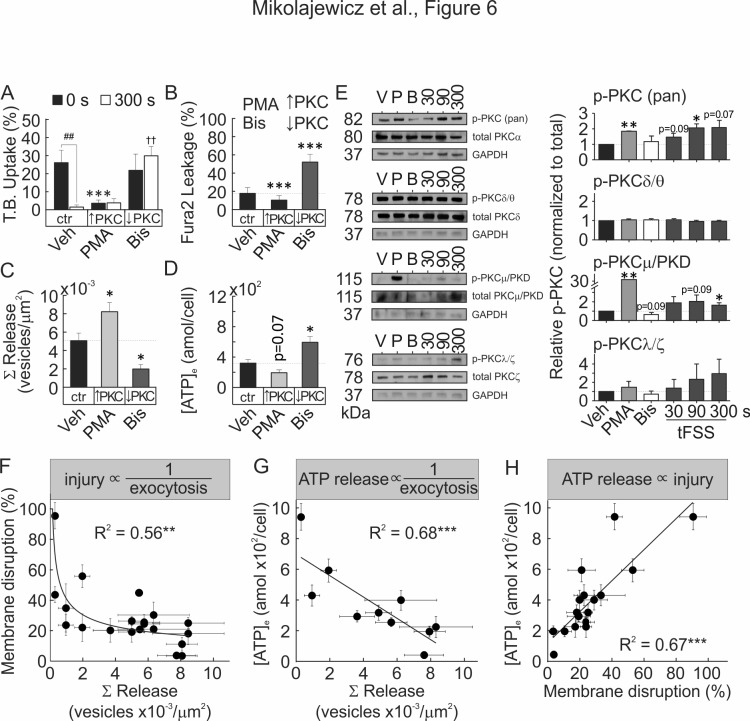
Figure 6—source data 1.
DOI: 10.7554/eLife.37812.032

Figure 6.

Figure 6—figure supplement 1. PKC regulates membrane resealing and ATP release in C2-OB cell line.

Figure 6—figure supplement 1.

(A–C) C2-OB were pre-treated (30 min) with vehicle, PMA or Bis. (A) Membrane permeability of micropipette-stimulated Fura2-loaded C2-OB was assessed by dye-leakage. Means ± SEM percentage of sIn cells, n = 11 stimulated cells. (B) Membrane permeability of C2-OB stimulated with tFSS (10x resuspensions) was assessed by staining at 0 or 300 s with T.B. Means ± SEM percentage of dye-positive cells, n = 7 separate cultures. (C) Amount of ATP released ([ATP]e) from tFSS-stimulated (10x resuspensions) C2-OB was assessed by bioluminescence assay. Means ± SEM attomoles ATP release per cell, 60 s after stimulation. Compared to vehicle (unless otherwise specified), **p<0.01 and ***p<0.001 indicate significance assessed by ANOVA followed by post-hoc Bonferroni test.
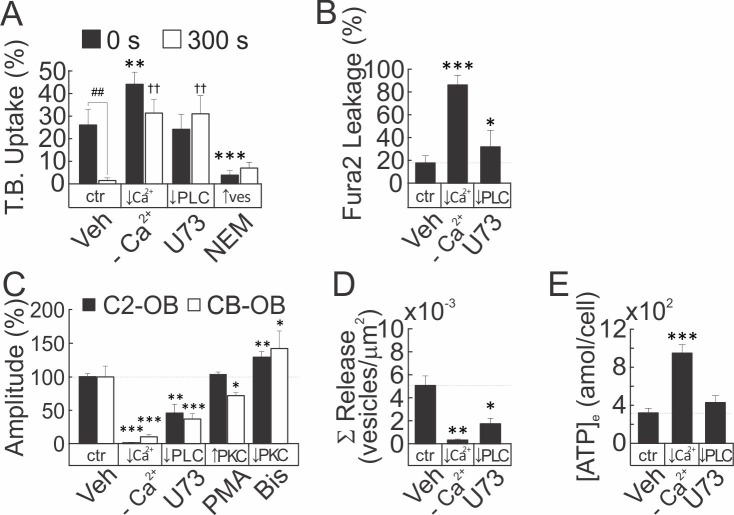
Figure 6—figure supplement 2. Membrane resealing, vesicular exocytosis and ATP release are Ca2+/PLC-dependent processes.

Figure 6—figure supplement 2.

(A–E) CB-OB were pretreated with vehicle, calcium-depleted physiological solution (-Ca2+), U73, NEM, PMA or Bis where indicated, and mechanically induced membrane injury (A, B) amplitude of [Ca2+]i elevations (C), vesicular exocytosis (D) and ATP release (E) were assessed. (A) TB uptake at 0 and 300 s after tFSS (10x), n = 5–8 separate cultures. (B) Fura2 leakage following micropipette stimulation, determined as percentage of sIn cells after micropipette-stimulation, n = 9–16 stimulated cells. (C) Amplitudes of micropipette-stimulated [Ca2+]i elevations in Fura2-loaded C2-OB and CB-OB cells, n = 9–16 stimulated cells. (D) Cumulative vesicular release over 100 s after micropipette-stimulation, n = 6–10 stimulated cells. (E) ATP release over 60 s following 10x tFSS stimulation, n = 8 separate cultures. For Figure 6—figure supplement 2, data are means ±SEM, ***significance compared to vehicle (0 s vehicle for A), ††significance compared to 300 s vehicle (A) and ## significance of indicated comparisons (A) by ANOVA or by regression.
Figure 6—figure supplement 3. Basal vesicular density and mechanically-stimulated vesicular release in compact bone-derived osteoblasts.

Figure 6—figure supplement 3.

(A–B) Quinacrine-loaded CB-OB were pretreated (30 min) with PMA, Bis, PMA + Bis, U73, U73 + PMA, [Ca2+]e-free PS, [Ca2+]e-free PS + PMA and NEM. Basal vesicular density (A) and cumulative vesicular release in response to stimulation by glass micropipette (B) were determined. Mean ± SEM vesicular density or cumulative vesicular release, normalized to unit area (n = 11–16 stimulated cells). Comparisons with vehicle; *p<0.05, **p<0.01 and ***p<0.001, or as specified; #p<0.05, ##p<0.01 and ###p<0.001, indicate significance assessed by ANOVA followed by post-hoc Bonferroni test.
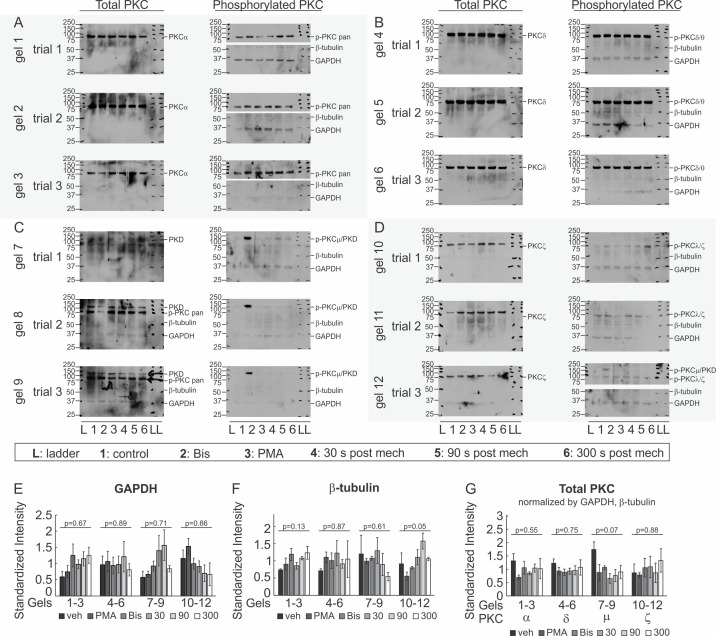
Figure 6—figure supplement 4. Immunoblot analysis of PKC isoforms.

Figure 6—figure supplement 4.

(A–D) Immunoblots for phospho- and total- conventional PKC (A), novel PKC (B), PKC/PKCµ (C) and atypical PKC (D) isoforms, and GAPDH and β-tubulin in cell lysates extracted from CB-OB treated with vehicle, PMA or Bis (30 min); or 30 s, 90 s or 300 s after tFSS (10x). (E–G) GAPDH (E) and β-tubulin (F) band intensities were averaged and used to normalize total PKC levels (G). Differences in loading controls and total PKC levels were assessed by ANOVA and p-values are reported, n = 3 cultures isolated from different mice.
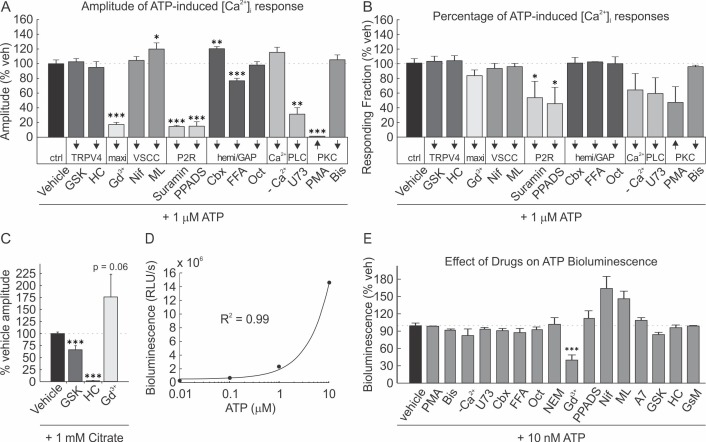
Figure 6—figure supplement 5. Effect of drug treatments on [Ca2+]i elevations and ATP bioluminescence assay.

Figure 6—figure supplement 5.

(A, B) Effect of drugs on P2 receptor-mediated [Ca2+]i elevation amplitude (A) and responsiveness (B). 1 µM ATP was applied to Fura2-loaded C2-OB pre-treated for 10 mins with vehicle (n = 30), GSK (n = 28), HC (n = 30), Gd3+ (n = 18), Nif (n = 46), ML (n = 45), Sur (n = 51), PPADS (n = 36), Cbx (n = 47), FFA (n = 45), Oct (n = 39) or 30 mins with [Ca2+]e-free PS (n = 62), U73 (n = 29), PMA (n = 18), or Bis (n = 48). Mean ±SEM response normalized to vehicle. Compared to vehicle, *p<0.05, **p<0.01 and ***p<0.001 indicate significance assessed by ANOVA followed by post-hoc Bonferroni test. (C) Effect of drugs on citrate-mediated [Ca2+]i elevation amplitude. 1 mM citrate was applied as TRP agonist to Fura2-loaded C2-OB pretreated for 10 mins with GSK (n = 48), HC (n = 18) or Gd3+ (n = 29). Mean ±SEM amplitude normalized to vehicle condition. For A-C, sample sizes are number of quantified cells from at least three independent cultures. (D) Calibration curve relating ATP standard concentrations to measured bioluminescence. Mean ± SEM relative light units per sec (RLU/s). Solid line, linear regression. (E) Effect of drugs on ATP bioluminescence assay. 10 nM ATP-dependent luciferin/luciferase bioluminescence was measured in the presence of PMA, Bis, [Ca2+]e-free PS, U73, Cbx, FFA, Oct, NEM, Gd3+, PPADS, Nif, ML, A7, GSK, HC, or GsM. Mean ± SEM RLU/s as percentage of vehicle condition. Compared to vehicle, **p<0.01 and ***p<0.001 indicate significance assessed by ANOVA followed by post-hoc Bonferroni test.