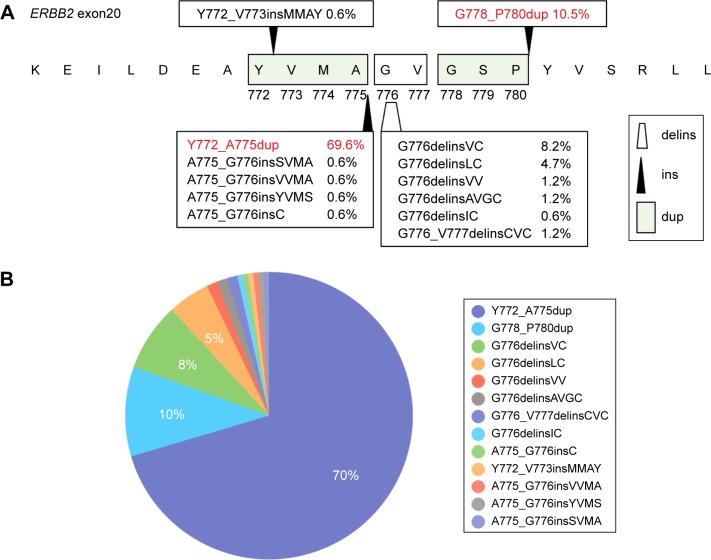
Figure 1.
Structure and distribution of ERBB2 20ins.
Notes: (A) Schematic diagram demonstrates the amino acids change of 20ins subtypes in ERBB2 kinase domain. The black arrows indicate the insertion position and trapezoid shape presents the position of deletion combined with insertion. (B) The pie chart presents the proportion of each 20ins subtype in the 171 cohort.
Abbreviations: 20ins, exon 20 insertions; delins, deletion and insertion; dup, duplicate; ins, insertion.

