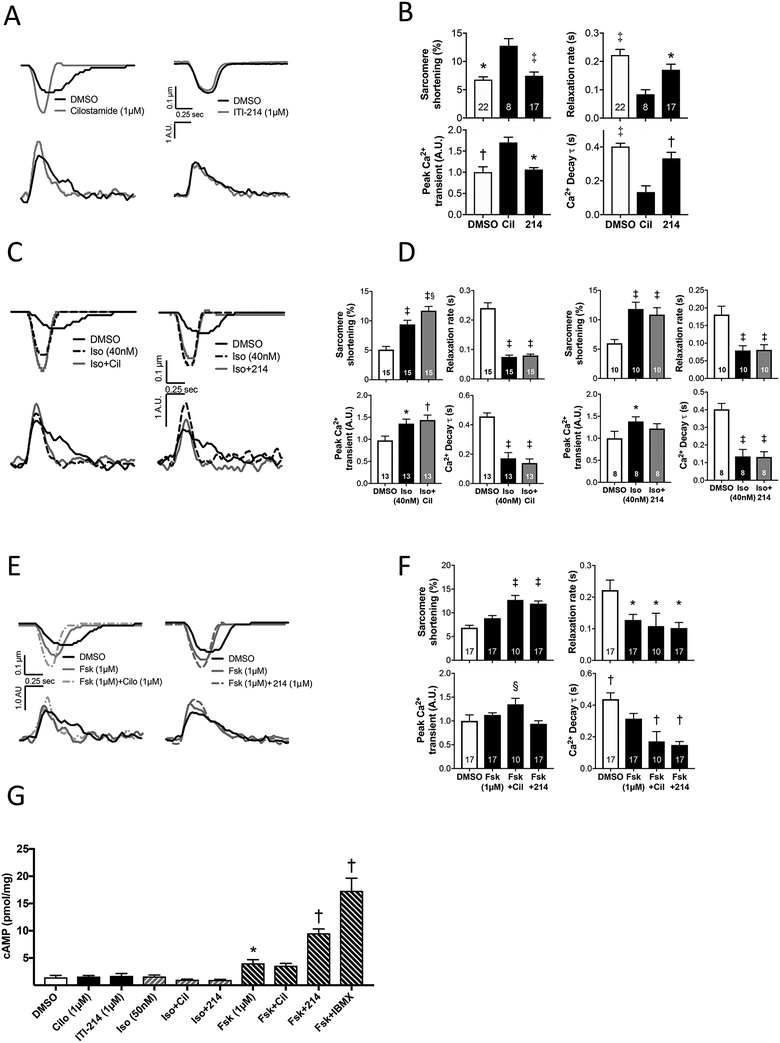
Figure 6. ITI-214 increases cAMP-mediated contractility in isolated rabbit cardiomyocytes.
A) Example traces of sarcomere shortening and Ca2+ transients in response cilostamide or ITI-214. B) Mean change of sarcomere shortening and relaxation rate, and normalized peak Ca2+ transient and exponential time-constant of Ca2+ decline (*p<0.05, †p<0.01, ‡ p<0.001 vs cilostamide; C) Example traces in response to isoproterenol ± cilostamide or ITI-214, and D) corresponding grouped data (*p<0.05, † p<0.01, ‡ p<0.001 vs DMSO, §p<0.001 vs Iso by two-way RM-ANOVA with Sidak’s post-hoc test). E) Example traces in response to forskolin ± cilostamide or ITI-214, and F) corresponding grouped data (*p<0.05 vs DMSO, † p≤0.05 vs Fsk, ‡ p<0.005 vs Fsk and DMSO, § p<0.03 vs DMSO and Fsk+ITI-214, Kruskal-Wallis test with Dunn’s post-hoc test). The number of myocyte for each group is shown. G) Intracellular cAMP in response to various activators/PDE inhibitors. Doses are shown and are the same as used in the functional assays (e.g. panels A, C, and E). *p<0.05 vs DMSO, †p<0.0005 vs Fsk. All analysis is performed by One-way ANOVA with Sidak’s multiple comparison test unless individual noted above. Cil = cilostamide, 214 = ITI-214, Iso = isoproterenol, Fsk = forskolin.

