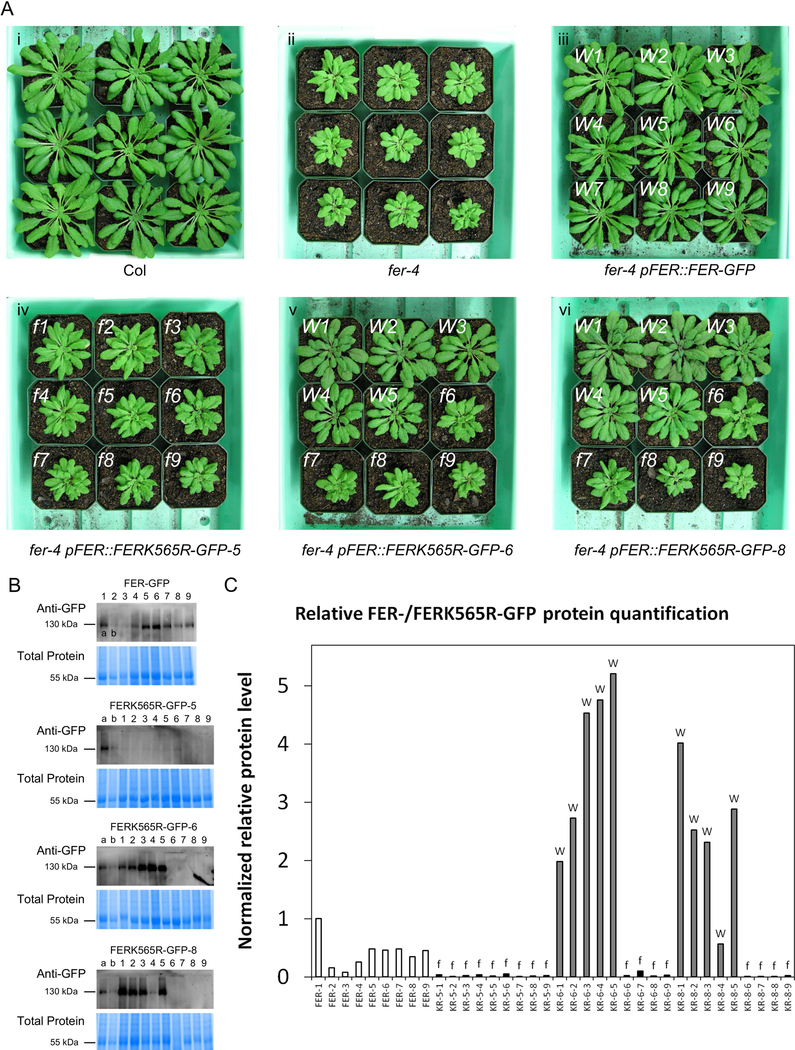
Figure 1. fer-4 lines expressing the kinase-dead FERK565R-GFP protein show different expression levels that correlate with their morphological phenotypes.
(A) Representative plant images of Col (i), fer-4 mutants (ii), fer-4 pFER::FER-GFP plants (iii), and three fer-4 pFER::FERK565R-GFP lines (iv, v and vi) with two types of morphologies. Plants in the fer-4 pFER::FER-GFP line (iii) display wild-type-like morphology (indicated with a white ‘W’ at the top left of each pot) as expected, while plants in the fer-4 pFER::FERK565R-GFP-5 line (iv) display fer morphology (indicated with a white ‘f” at the top left of each pot). Individual plants in the fer-4 pFER::FERK565R-GFP-6 (v) and fer-4 pFER::FERK565R-GFP-8 (vi) lines display WT-like (W) or fer-like (‘f’) morphologies. (B) Anti-GFP immunoblots of total protein samples extracted from plants shown in panel A. Gel Code Blue stained total protein is shown below each blot, and samples labeled ‘a’ and ‘b’ (FER-GFP plants #1 and #2) are included in all blots for comparison. Samples are numbered in accordance with the plant numbering in panel A. (C) Relative quantification of FER-/FERK565R-GFP protein levels from the immunoblots in panel B. Band intensity was normalized to total protein levels from the Gel Code Blue stained total protein in panel B and quantified relative to the FER-GFP plant #1 sample (labeled ‘a’) on each blot. The phenotype of each FERK565R-GFP plant (abbreviated as ‘KR’ on the X-axis) is indicated with an ‘f’ or ‘W’ (based on and corresponding to panel A) above each bar.

