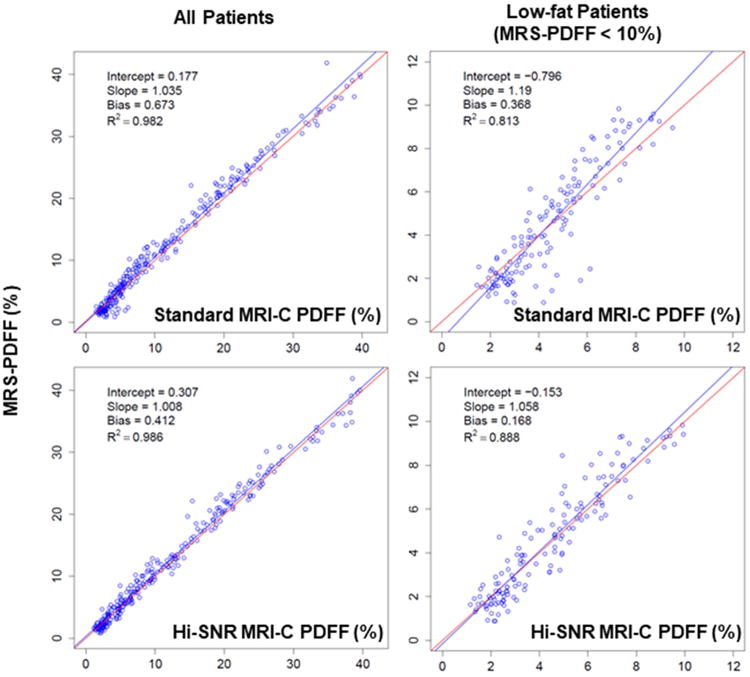
Figure 3.

Regression plots of MRS-PDFF as a function of standard MRI-C PDFF (top panels) and Hi-SNR MRI-C PDFF (bottom panels), for all patients (left panels) and low-fat patients (right panels). The line of best fit is shown in blue. The line of perfect MRS to MRI-C PDFF agreement (slope = 1, intercept = 0) is depicted in red.
