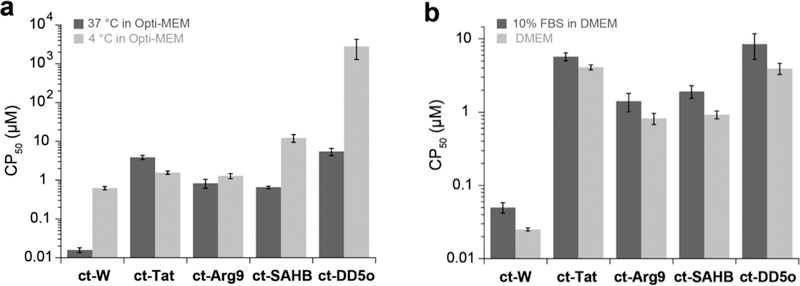
Figure 2. Cell penetration profiling.

a) CAPA results for ct-W, ct-Tat, ct-Arg9, ct-SAHB, and ct-DD5o, tested at 37 °C and 4 °C. ct-molecules were incubated with cells for 4 h in Opti-MEM. Graph shows CP50 values on a log scale, and error bars show standard error from three independent experiments CP50 values are provided in SI Table 2. b) Effects of serum on cell penetration with CAPA. Peptides were incubated for 4 h at 37 °C in DMEM with or without 10% FBS. CP50 values are provided in SI Table 3. Graph shows CP50 values on a log scale, and error bars show standard error from three independent experiments.
